

Question: Step 4: Grouping Data and Making a Chart We will now make a frequency table of AGE. Generate a new Pivot Table. 1. Click on
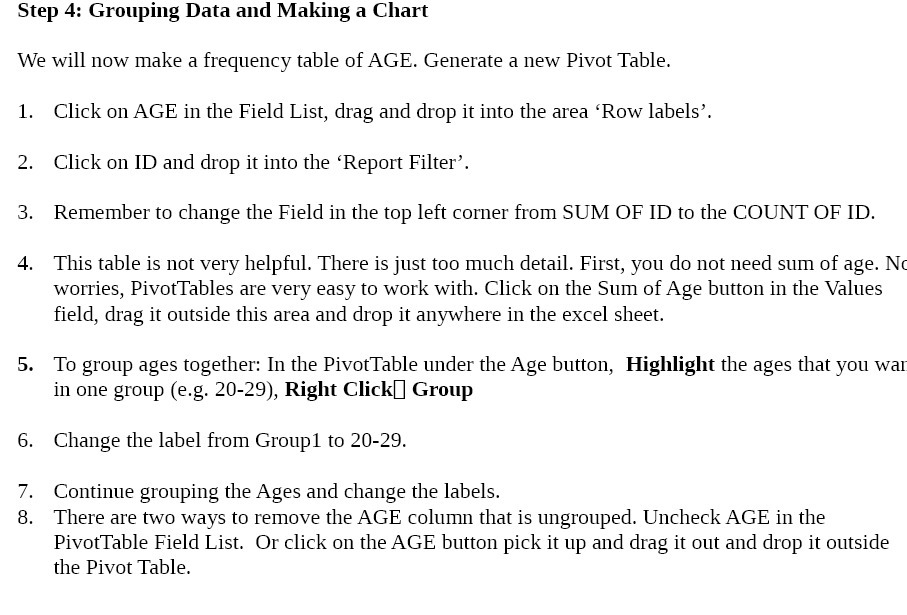
Step 4: Grouping Data and Making a Chart We will now make a frequency table of AGE. Generate a new Pivot Table. 1. Click on AGE in the Field List, drag and drop it into the area 'Row labels'. 2. Click on ID and drop it into the 'Report Filter'. 3. Remember to change the Field in the top left corner from SUM OF ID to the COUNT OF ID. 4. This table is not very helpful. There is just too much detail. First, you do not need sum of age. Nt worries, PivotTables are very easy to work with. Click on the Sum of Age button in the 1Values eld, drag it outside this area and drop it anywhere in the excel sheet. 5. To group ages together: In the PivotTahle under the Age button, Highlight the ages that you war. in one group (e.g. 20-29), Right ClickD Group 6. Change the label from Groupl to 20-29. 7. Continue grouping the Ages and change the labels. 8. There are two ways to remove the AGE column that is ungrouped. Uncheck AGE in the PivotTable Field List. Or click on the AGE button pick it up and drag it out and drop it outside the Pivot Table
Step by Step Solution
There are 3 Steps involved in it

Get step-by-step solutions from verified subject matter experts