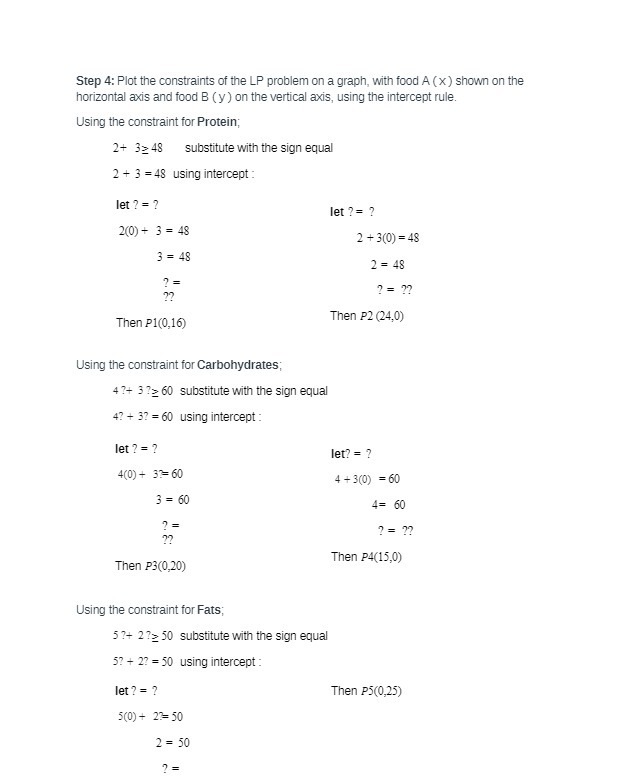
Question: Step 4: Plot the constraints of the LP problem on a graph, with food A (x ) shown on the horizontal axis and food B

Step 4: Plot the constraints of the LP problem on
Step 4: Plot the constraints of the LP problem on a graph, with food A (x ) shown on the horizontal axis and food B (y ) on the vertical axis, using the intercept rule. Using the constraint for Protein; 2+ 3= 48 substitute with the sign equal 2 + 3 =48 using intercept : let ? = ? let ? = ? 2(0) + 3 = 48 2 + 3(0) = 48 3 = 48 2 = 48 ? = ? = ?? Then P1(0,16) Then P2 (24,0) Using the constraint for Carbohydrates, 4?+ 3?> 60 substitute with the sign equal 4? + 3? =60 using intercept : let ? = ? let? = ? 4(0) + 31=60 4 +3(0) =60 3 = 60 4= 60 2 : ? = ?? Then P4(15,0) Then P3(0,20) Using the constraint for Fats; 57+ 273 50 substitute with the sign equal 57 + 2? =50 using intercept : let ? = ? Then P5(0,25) 5(0) + 27-50 2 = 50 7 =

Step by Step Solution

There are 3 Steps involved in it

1 Expert Approved Answer
Step: 1 Unlock blur-text-image
Question Has Been Solved by an Expert!

Get step-by-step solutions from verified subject matter experts

Step: 2 Unlock
Step: 3 Unlock

Students Have Also Explored These Related Mathematics Questions!