

Question: STEP BY STEP EXPLANATION PLS 1. Using the following table, What is the percent of the relative 'equency of a Blue car being observed? Car
STEP BY STEP EXPLANATION PLS
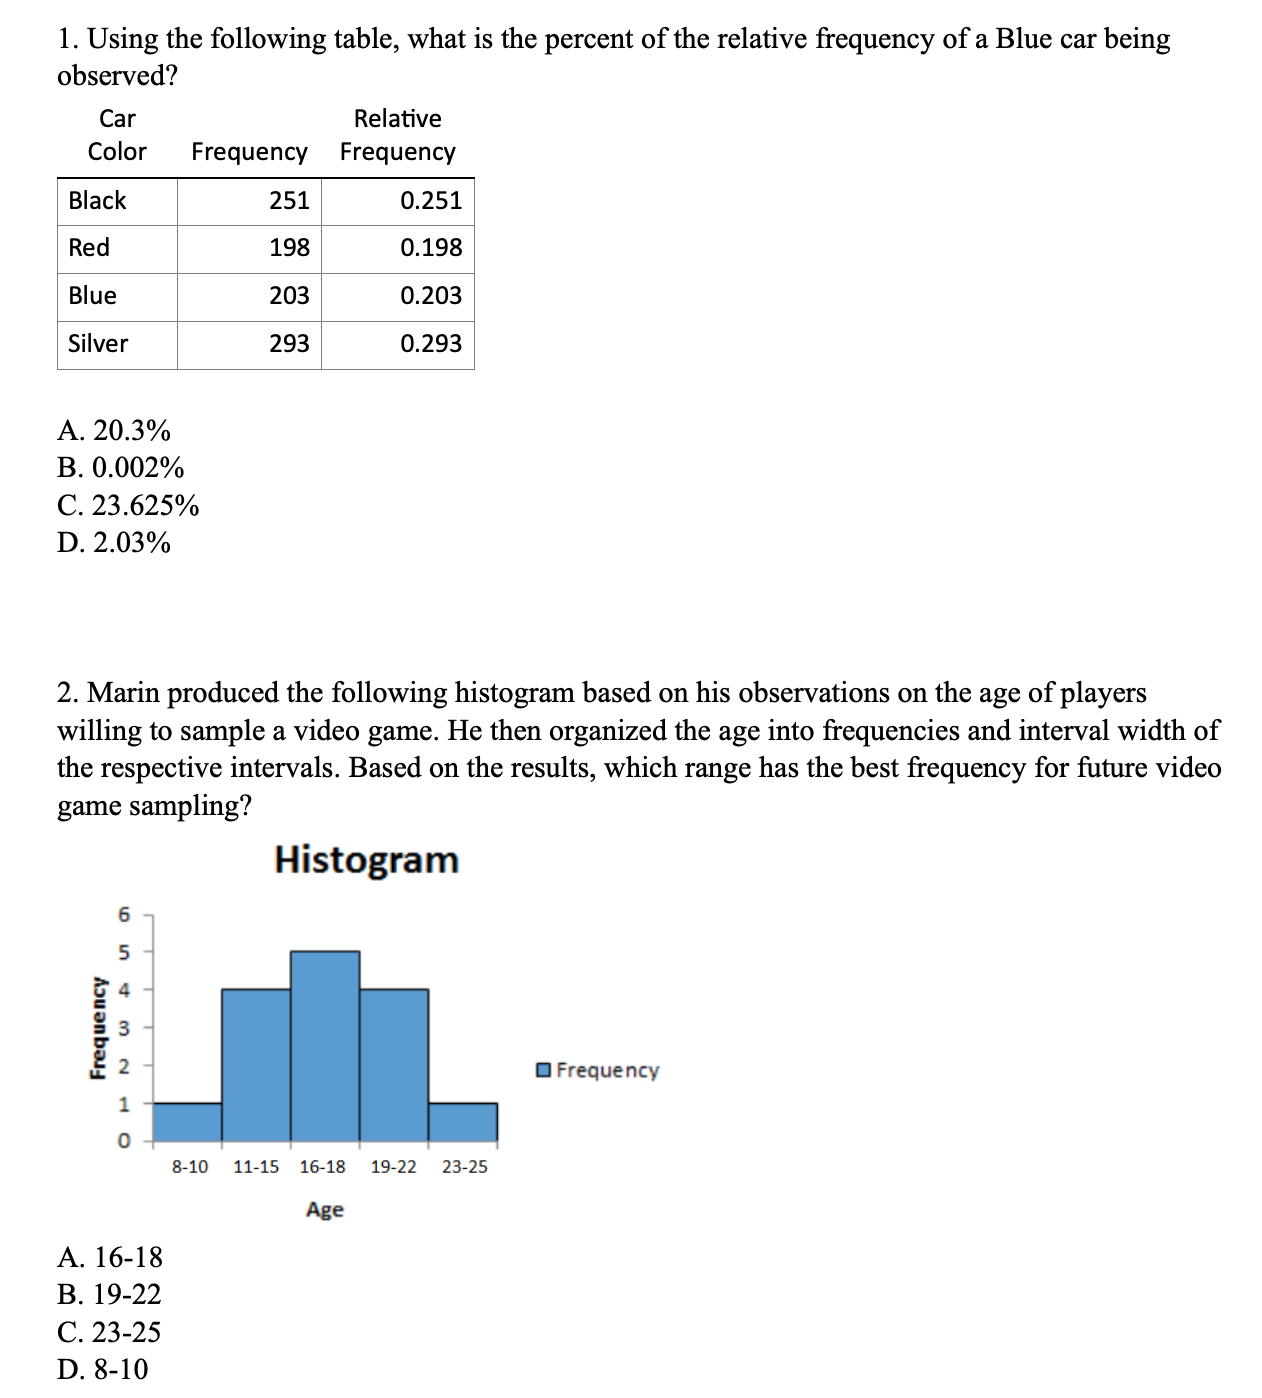
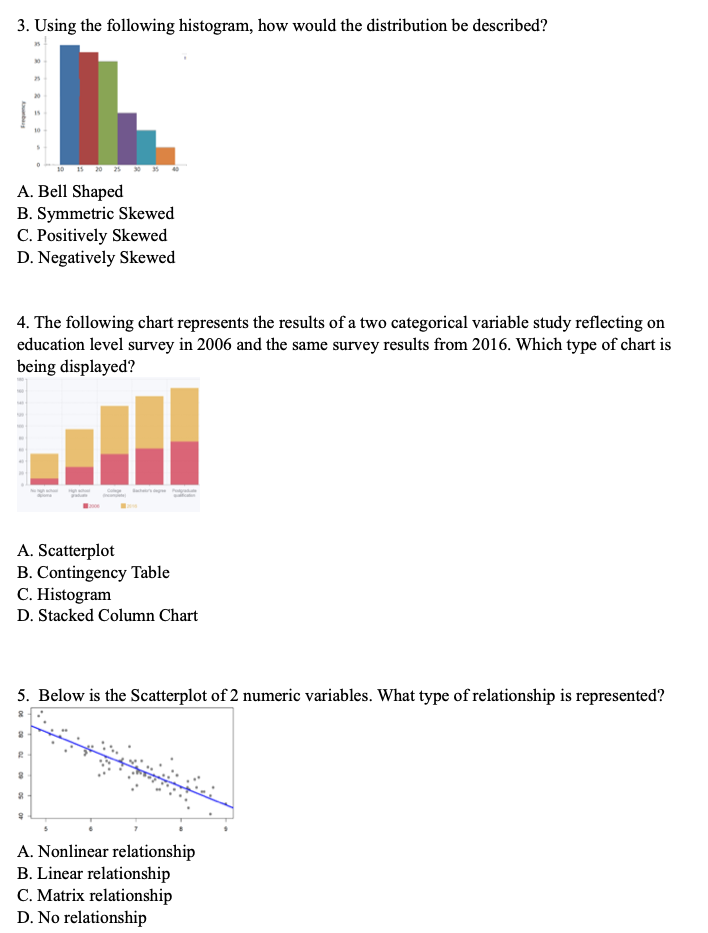
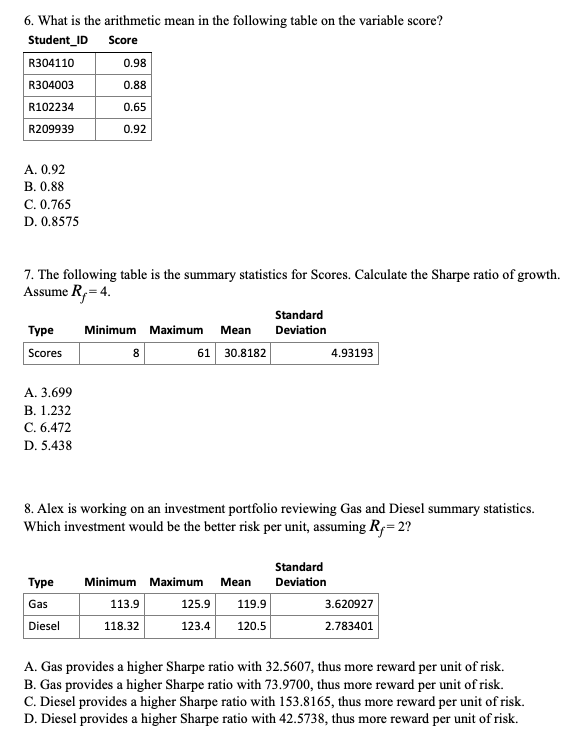
1. Using the following table, What is the percent of the relative 'equency of a Blue car being observed? Car Relative Color Frequency Frequency Black 251 0.251 Red 198 0.198 Blue 203 0.203 Silver 293 0.293 A. 20.3% B. 0.002% C. 23.625% D. 2.03% 2. Marin produced the following histogram based on his observations on the age of players willing to sample a video game. He then organized the age into frequencies and interval width of the respective intervals. Based on the results, which range has the best frequency for future video game sampling? Histogram 6 5 I: 4 '.' 3 E 2 IFrequency 1 0 310 11-15 16-18 19-22 23-25 Age A. 16-18 B. 1922 c. 2325 D. 8-10 3. Using the following histogram, how would the distribution be described? A. Bell Shaped B. Symmetric Skewed C. Positively Skewed D. Negatively Skewed 4. The following chart represents the results of a two categorical variable study reflecting on education level survey in 2006 and the same survey results from 2016. Which type of chart is being displayed? A. Scatterplot B. Contingency Table C. Histogram D. Stacked Column Chart 5. Below is the Scatterplot of 2 numeric variables. What type of relationship is represented? A. Nonlinear relationship B. Linear relationship C. Matrix relationship D. No relationship6. What is the arithmetic mean in the following table on the variable score? Student_ID Score R304110 0.98 R304003 0.88 R102234 0.65 R209939 0.92 A. 0.92 B. 0.88 C. 0.765 D. 0.8575 7. The following table is the summary statistics for Scores. Calculate the Sharpe ratio of growth. Assume R = 4. Standard Type Minimum Maximum Mean Deviation Scores 8 61 30.8182 4.93193 A. 3.699 B. 1.232 C. 6.472 D. 5.438 8. Alex is working on an investment portfolio reviewing Gas and Diesel summary statistics. Which investment would be the better risk per unit, assuming Ry = 2? Standard Type Minimum Maximum Mean Deviation Gas 113.9 125.9 119.9 3.620927 Diesel 118.32 123.4 120.5 2.783401 A. Gas provides a higher Sharpe ratio with 32.5607, thus more reward per unit of risk. B. Gas provides a higher Sharpe ratio with 73.9700, thus more reward per unit of risk. C. Diesel provides a higher Sharpe ratio with 153.8165, thus more reward per unit of risk. D. Diesel provides a higher Sharpe ratio with 42.5738, thus more reward per unit of risk
Step by Step Solution
There are 3 Steps involved in it

Get step-by-step solutions from verified subject matter experts