

Question: step by step process so i can learn how to do it folowing isble a. Devpiop a p-chart for 95 percent consdence (1 96 standart
step by step process so i can learn how to do it 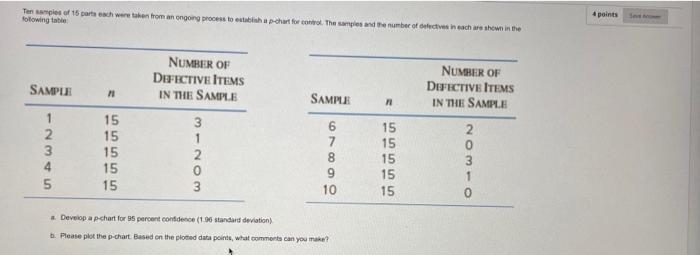
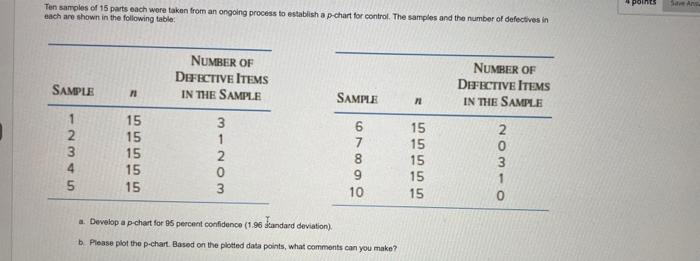
folowing isble a. Devpiop a p-chart for 95 percent consdence (1 96 standart deviation) b. Pleate plot the p-chart. Based on the plotied data points, what commonts can you make? Ten samples of 15 parts each wore taken from an ongoing process to 6stablish a p-chart for controf, The samples and the number of defectives in each aro shown in the following table: a. Develop a p-chart for 95 percent confidence (1.96 dtandard derviation). b. Please plot tho p-chart. Basod on the ploted dada points, what camments can you make
Step by Step Solution
There are 3 Steps involved in it
1 Expert Approved Answer
Step: 1 Unlock

Question Has Been Solved by an Expert!
Get step-by-step solutions from verified subject matter experts
Step: 2 Unlock
Step: 3 Unlock