

Question: step by step with how to get the range 1. Minori Fruit Juice company sells a 24 fl.oz. glass container filled of Cranprune juice. In
step by step with how to get the range 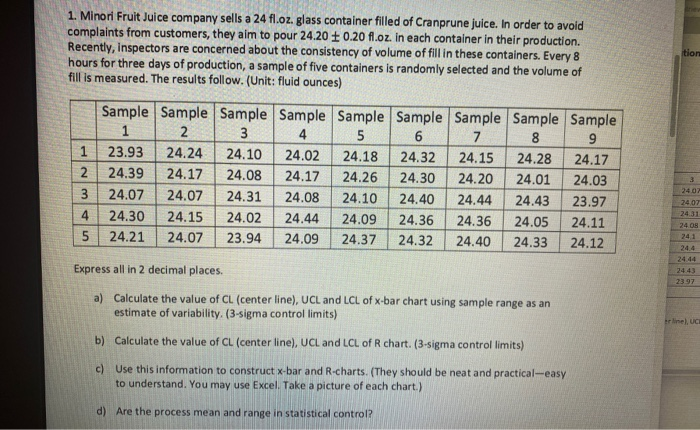
1. Minori Fruit Juice company sells a 24 fl.oz. glass container filled of Cranprune juice. In order to avoid complaints from customers, they aim to pour 24.20 +0.20 fl.oz. in each container in their production. Recently, inspectors are concerned about the consistency of volume of fill in these containers. Every 8 hours for three days of production, a sample of five containers is randomly selected and the volume of fill is measured. The results follow. (Unit: fluid Ounces) tion 1 1 2 3 4 5 Sample Sample Sample Sample Sample Sample Sample Sample Sample 2 3 4 5 7 8 9 23.93 24.24 24.10 24.02 24.18 24.32 24.15 24.28 24.17 24.39 24.17 24.08 24.17 24.26 24.30 24.20 24.01 24.03 24.07 24.07 24.31 24.08 24.10 24.40 24.44 24.43 23.97 24.30 24.15 24.02 24.44 24.09 24.36 24.36 24.05 24.11 24.21 24.07 23.94 24.09 24.37 24.32 24.40 24.33 24.12 3 24.07 2407 24.31 24.08 241 24.4 Express all in 2 decimal places. 24.43 23 97 a) Calculate the value of CL (center line), UCL and LCL of x-bar chart using sample range as an estimate of variability, (3-sigma control limits) Erinel, UCH b) Calculate the value of CL (center line), UCL and LCL of R chart. (3-sigma control limits) c) Use this information to construct x-bar and R-charts. (They should be neat and practical-easy to understand. You may use Excel. Take a picture of each chart.) d) Are the process mean and range in statistical control
Step by Step Solution
There are 3 Steps involved in it
1 Expert Approved Answer
Step: 1 Unlock

Question Has Been Solved by an Expert!
Get step-by-step solutions from verified subject matter experts
Step: 2 Unlock
Step: 3 Unlock