

Question: step1: Using subplot() and ezplot(): plot y1 and y2 versus x into 2-by-1window. y1=cosh(3x) y2=sinh(x) step2: Label your own x-axis, y-axis, and title. step3: paste
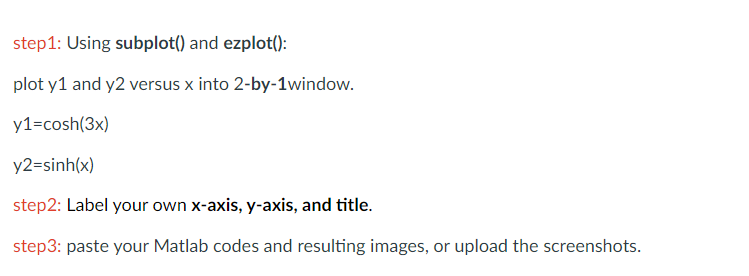
step1: Using subplot() and ezplot(): plot y1 and y2 versus x into 2-by-1window. y1=cosh(3x) y2=sinh(x) step2: Label your own x-axis, y-axis, and title. step3: paste your Matlab codes and resulting images, or upload the screenshots
Step by Step Solution
There are 3 Steps involved in it
1 Expert Approved Answer
Step: 1 Unlock

Question Has Been Solved by an Expert!
Get step-by-step solutions from verified subject matter experts
Step: 2 Unlock
Step: 3 Unlock