Could you help with this lab?
Thank you so much!
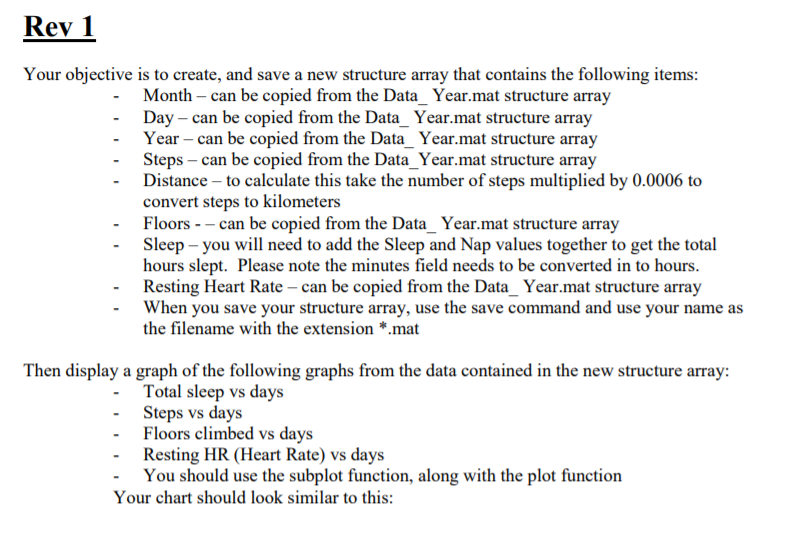
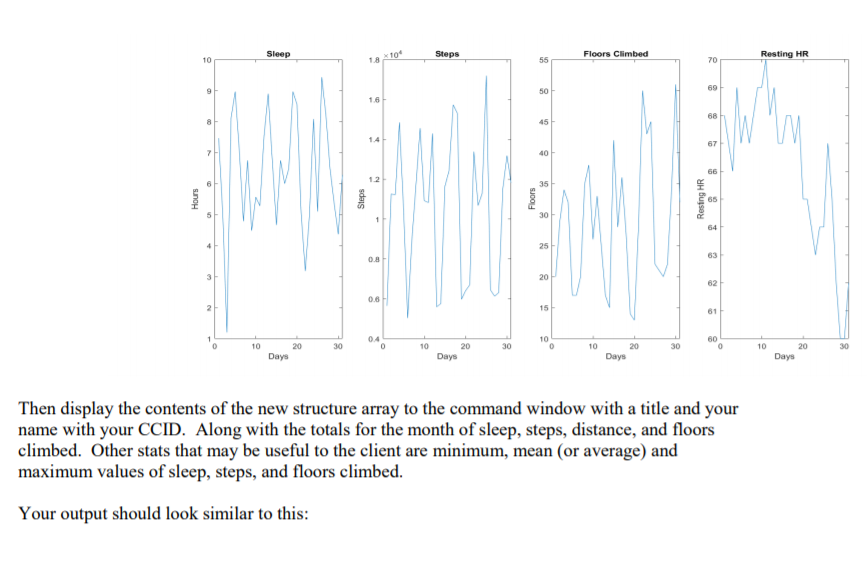
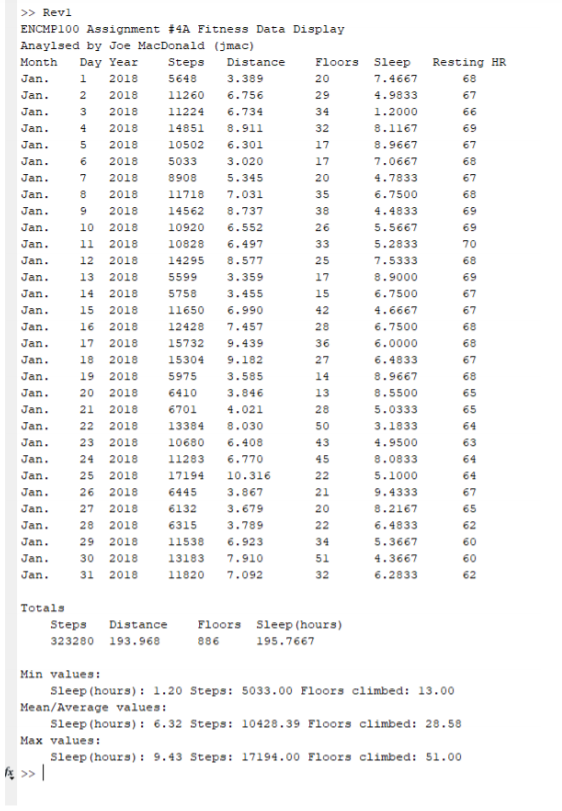
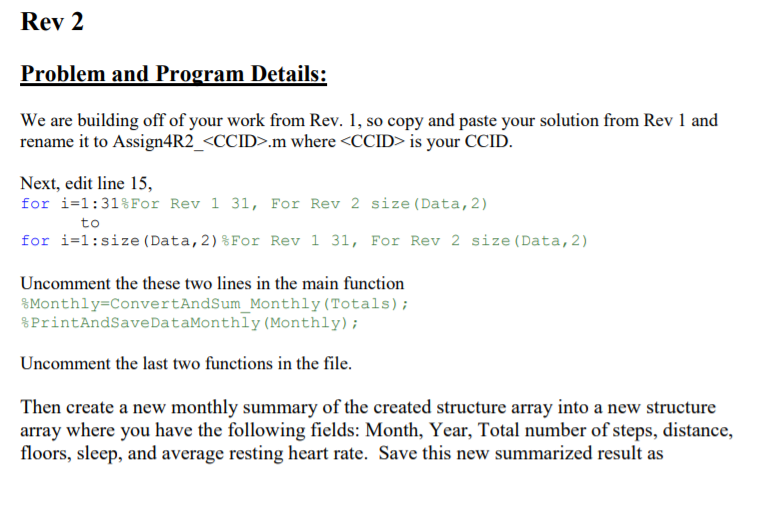
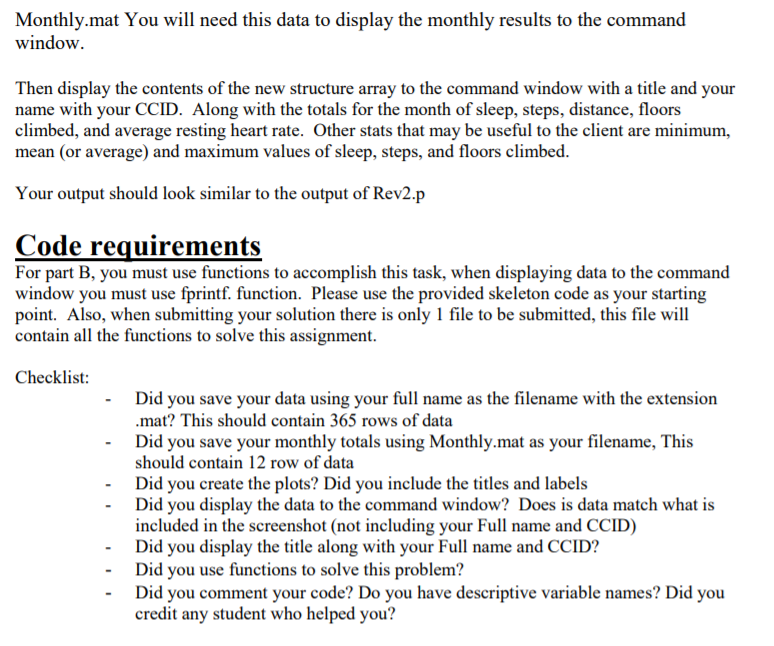
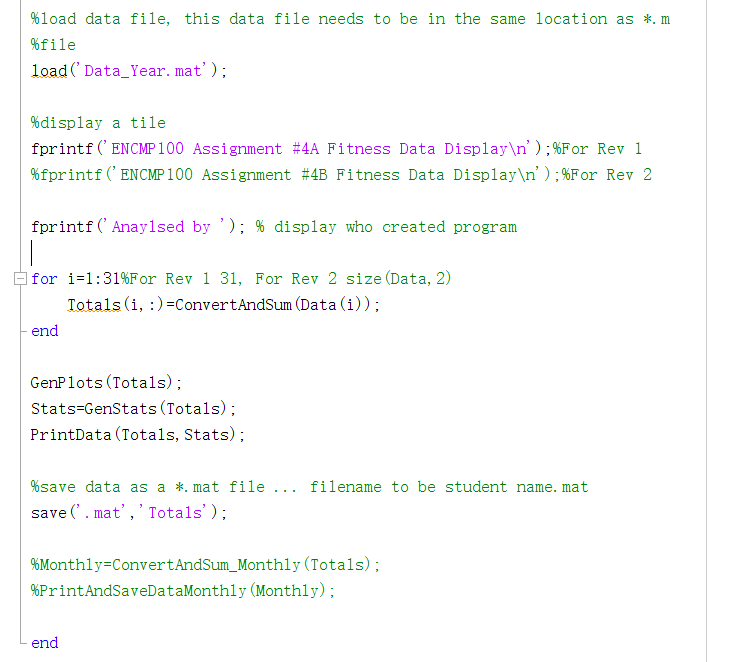
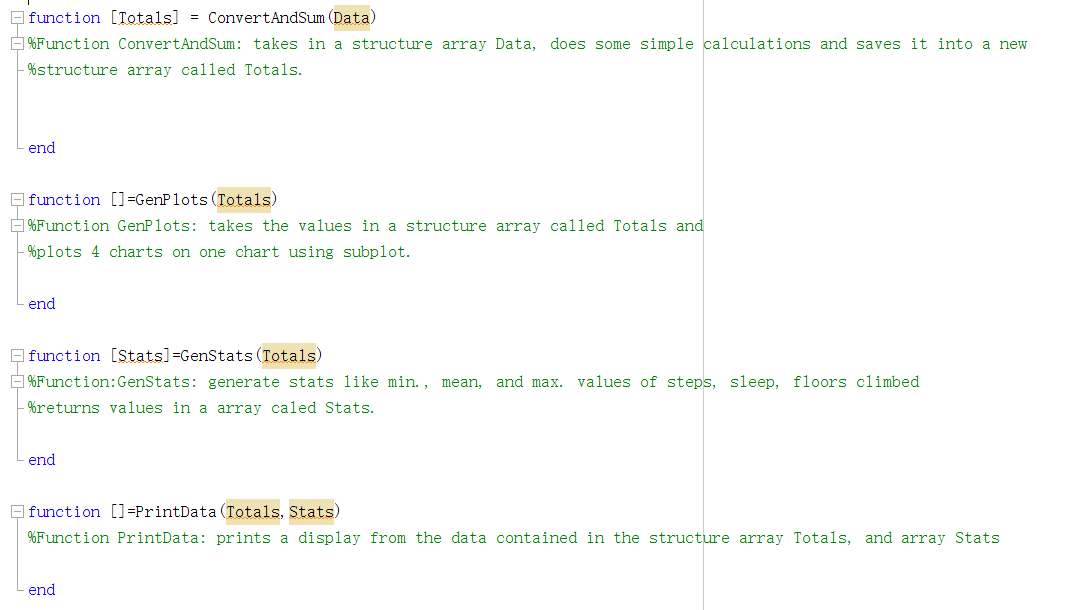
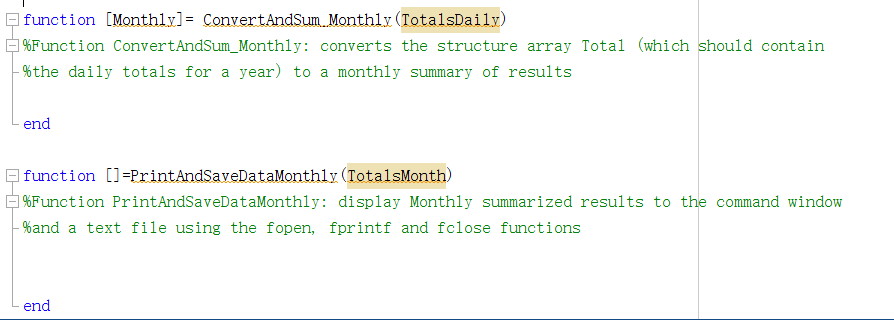
Problem and Program Details: Rev 0 Getting Started You are tasked with providing a reader-friendly summary of a client's fitbit data. This will be an integral part of a report of the client's health and activity. Posted on eClass, under Lab 4 Information is a zip file containing four files: Data_Year.mat -> this is your data file which contains fitbit data for a year Assign4_ccid.m -> a template to work from Rev1.p -> Program outputs for Rev 1 of your code Rev2.p -> Program outputs for Rev 2 of your code Unzip the contents in to a directory or folder and work from that directory or folder. The data file and *.m file must be in the same directory or folder. Remember to rename the skeleton code filename with your CCID. To run the included Revl.p or Rev2.p, in Matlab, goto your current folder window where you have unzipped your files, right click on *.p and select run. Review the outputs on the command window, and the files that are created after the program runs. Rev 1 Your objective is to create, and save a new structure array that contains the following items: - Month can be copied from the Data_ Year.mat structure array Day - can be copied from the Data_Year.mat structure array Year - can be copied from the Data_ Year.mat structure array Steps - can be copied from the Data_Year.mat structure array Distance - to calculate this take the number of steps multiplied by 0.0006 to convert steps to kilometers Floors -- can be copied from the Data_ Year.mat structure array Sleep - you will need to add the Sleep and Nap values together to get the total hours slept. Please note the minutes field needs to be converted in to hours. Resting Heart Rate - can be copied from the Data_Year.mat structure array When you save your structure array, use the save command and use your name as the filename with the extension *.mat Then display a graph of the following graphs from the data contained in the new structure array: - Total sleep vs days - Steps vs days - Floors climbed vs days Resting HR (Heart Rate) vs days You should use the subplot function, along with the plot function Your chart should look similar to this: Sleep Steps Floors Climbed 10 55 Resting HR 1810 70 69 9 50 1.6 68 8 45 67 40 66 12 35 Hours Steps Floors Resing HR 30 64 25 63 08 20 62 0.6H 2 15 61 04 10 60 10 30 10 30 10 30 10 30 20 Days 20 Days 20 Days 20 Days Then display the contents of the new structure array to the command window with a title and your name with your CCID. Along with the totals for the month of sleep, steps, distance, and floors climbed. Other stats that may be useful to the client are minimum, mean (or average) and maximum values of sleep, steps, and floors climbed. Your output should look similar to this: Resting HR 68 67 66 69 67 >> Revi ENCMP100 Assignment #4A Fitness Data Display Anayised by Joe MacDonald (jmac) Month Day Year Steps Distance Floors Jan. 1 2018 5648 3.389 20 Jan. 2 2018 11260 6.756 29 Jan. 3 2018 11224 6.734 34 Jan. 2018 14851 8.911 32 Jan. 5 2018 10502 6.301 17 Jan. 2018 5033 3.020 17 Jan. 7 2018 8908 5.345 20 Jan. 8 2018 11718 7.031 35 Jan. 9 2018 14562 8.737 38 Jan. 10 2018 10920 6.552 26 Jan. 11 2018 10828 6.497 33 Jan. 12 2018 14295 8.577 25 Jan. 13 2018 5599 3.359 17 Jan. 14 2018 5758 3.455 15 Jan. 15 2018 11650 6.990 42 2018 12428 7.457 28 Jan. 17 2018 15732 9.439 36 Jan. 18 2018 15304 9.182 27 Jan. 19 2018 5975 3.585 14 Jan. 20 2018 6410 3.846 13 21 2018 6701 4.021 28 Jan. 22 2018 13384 8.030 50 Jan. 23 2018 10680 6.408 43 Jan. 24 2018 11283 6.770 45 Jan. 25 2018 17194 10.316 22 Jan. 26 2018 6445 3.867 21 Jan. 2018 6132 3.679 20 Jan. 28 2018 6315 3.789 22 Jan. 29 2018 11538 6.923 34 Jan. 30 2018 13183 7.910 51 Jan. 31 2018 11820 7.092 32 68 67 68 69 69 70 68 69 67 67 Jan. Sleep 7.4667 4.9833 1.2000 8.1167 8.9667 7.0667 4.7833 6.7500 4.4833 5.5667 5.2833 7.5333 8.9000 6.7500 4.6667 6.7500 6.0000 6.4833 8.9667 8.5500 5.0333 3.1833 4.9500 8.0833 5.1000 9.4333 8.2167 6.4833 5.3667 4.3667 6.2833 16 68 Jan. 68 67 68 65 65 64 63 64 64 67 65 62 60 60 62 27 Totals Steps Distance 323280 193.968 Floors Sleep (hours) 886 195.7667 Min values: Sleep (hours) : 1.20 Steps: 5033.00 Floors climbed: 13.00 Mean/Average values: Sleep (hours) : 6.32 Steps: 10428.39 Floors climbed: 28.58 Max values: Sleep (hours): 9.43 Steps: 17194.00 Floors climbed: 51.00 fx >> Rev 2 Problem and Program Details: We are building off of your work from Rev. 1, so copy and paste your solution from Rev 1 and rename it to Assign4R2_.m where is your CCID. Next, edit line 15, for i=1:31%For Rev 1 31, For Rev 2 size (Data, 2) to for i=1:size (Data, 2) For Rev 1 31, For Rev 2 size (Data,2) Uncomment the these two lines in the main function Monthly=ConvertAndSum_Monthly (Totals); %PrintAndSaveDataMonthly (Monthly); Uncomment the last two functions in the file. Then create a new monthly summary of the created structure array into a new structure array where you have the following fields: Month, Year, Total number of steps, distance, floors, sleep, and average resting heart rate. Save this new summarized result as Monthly.mat You will need this data to display the monthly results to the command window. Then display the contents of the new structure array to the command window with a title and your name with your CCID. Along with the totals for the month of sleep, steps, distance, floors climbed, and average resting heart rate. Other stats that may be useful to the client are minimum, mean (or average) and maximum values of sleep, steps, and floors climbed. Your output should look similar to the output of Rev2.p Code requirements For part B, you must use functions to accomplish this task, when displaying data to the command window you must use fprintf. function. Please use the provided skeleton code as your starting point. Also, when submitting your solution there is only 1 file to be submitted, this file will contain all the functions to solve this assignment. Checklist: Did you save your data using your full name as the filename with the extension .mat? This should contain 365 rows of data Did you save your monthly totals using Monthly.mat as your filename, This should contain 12 row of data Did you create the plots? Did you include the titles and labels Did you display the data to the command window? Does is data match what is included in the screenshot (not including your Full name and CCID) - Did you display the title along with your Full name and CCID? Did you use functions to solve this problem? Did you comment your code? Do you have descriptive variable names? Did you credit any student who helped you? %10ad data file, this data file needs to be in the same location as *. m %file load('Data_Year. mat'); %display a tile fprintf('ENCMP100 Assignment #4A Fitness Data Display '); %For Rev 1 %fprintf('ENCMP100 Assignment #4B Fitness Data Display '); %For Rev 2 fprintf('Anaylsed by '); % display who created program for i=1:31%For Rev 1 31, For Rev 2 size (Data, 2) Totals (i, :)=ConvertAndSum (Data (i)); end GenPlots (Totals); Stats=GenStats (Totals); PrintData (Totals, Stats); %save data as a *. mat file ... filename to be student name. mat save('. mat','Totals'); %Monthly=ConvertAndSum_Monthly (Totals); %PrintAndSaveDataMonthly Monthly); end function [Totals] = ConvertAndSum (Data) %Function ConvertAndSum: takes in a structure array Data, does some simple calculations and saves it into a new %structure array called Totals. end function [] =Genplots (Totals) %Function GenPlots: takes the values in a structure array called Totals and %plots 4 charts on one chart using subplot. end function (Stats] =GenStats (Totals) %Function: GenStats: generate stats like min., mean, and max. values of steps, sleep, floors climbed %returns values in a array caled Stats. end E function []=PrintData (Totals, Stats) %Function PrintData: prints a display from the data contained in the structure array Totals, and array Stats end function (Monthly] = ConvertAndSum Monthly (TotalsDaily) %Function ConvertAndSum_Monthly: converts the structure array Total (which should contain -%the daily totals for a year) to a monthly summary of results end function ()=PrintAndSaveDataMonthly (TotalsMonth) %Function PrintAndSaveDataMonthly: display Monthly summarized results to the command window %and a text file using the fopen, fprintf and fclose functions end Problem and Program Details: Rev 0 Getting Started You are tasked with providing a reader-friendly summary of a client's fitbit data. This will be an integral part of a report of the client's health and activity. Posted on eClass, under Lab 4 Information is a zip file containing four files: Data_Year.mat -> this is your data file which contains fitbit data for a year Assign4_ccid.m -> a template to work from Rev1.p -> Program outputs for Rev 1 of your code Rev2.p -> Program outputs for Rev 2 of your code Unzip the contents in to a directory or folder and work from that directory or folder. The data file and *.m file must be in the same directory or folder. Remember to rename the skeleton code filename with your CCID. To run the included Revl.p or Rev2.p, in Matlab, goto your current folder window where you have unzipped your files, right click on *.p and select run. Review the outputs on the command window, and the files that are created after the program runs. Rev 1 Your objective is to create, and save a new structure array that contains the following items: - Month can be copied from the Data_ Year.mat structure array Day - can be copied from the Data_Year.mat structure array Year - can be copied from the Data_ Year.mat structure array Steps - can be copied from the Data_Year.mat structure array Distance - to calculate this take the number of steps multiplied by 0.0006 to convert steps to kilometers Floors -- can be copied from the Data_ Year.mat structure array Sleep - you will need to add the Sleep and Nap values together to get the total hours slept. Please note the minutes field needs to be converted in to hours. Resting Heart Rate - can be copied from the Data_Year.mat structure array When you save your structure array, use the save command and use your name as the filename with the extension *.mat Then display a graph of the following graphs from the data contained in the new structure array: - Total sleep vs days - Steps vs days - Floors climbed vs days Resting HR (Heart Rate) vs days You should use the subplot function, along with the plot function Your chart should look similar to this: Sleep Steps Floors Climbed 10 55 Resting HR 1810 70 69 9 50 1.6 68 8 45 67 40 66 12 35 Hours Steps Floors Resing HR 30 64 25 63 08 20 62 0.6H 2 15 61 04 10 60 10 30 10 30 10 30 10 30 20 Days 20 Days 20 Days 20 Days Then display the contents of the new structure array to the command window with a title and your name with your CCID. Along with the totals for the month of sleep, steps, distance, and floors climbed. Other stats that may be useful to the client are minimum, mean (or average) and maximum values of sleep, steps, and floors climbed. Your output should look similar to this: Resting HR 68 67 66 69 67 >> Revi ENCMP100 Assignment #4A Fitness Data Display Anayised by Joe MacDonald (jmac) Month Day Year Steps Distance Floors Jan. 1 2018 5648 3.389 20 Jan. 2 2018 11260 6.756 29 Jan. 3 2018 11224 6.734 34 Jan. 2018 14851 8.911 32 Jan. 5 2018 10502 6.301 17 Jan. 2018 5033 3.020 17 Jan. 7 2018 8908 5.345 20 Jan. 8 2018 11718 7.031 35 Jan. 9 2018 14562 8.737 38 Jan. 10 2018 10920 6.552 26 Jan. 11 2018 10828 6.497 33 Jan. 12 2018 14295 8.577 25 Jan. 13 2018 5599 3.359 17 Jan. 14 2018 5758 3.455 15 Jan. 15 2018 11650 6.990 42 2018 12428 7.457 28 Jan. 17 2018 15732 9.439 36 Jan. 18 2018 15304 9.182 27 Jan. 19 2018 5975 3.585 14 Jan. 20 2018 6410 3.846 13 21 2018 6701 4.021 28 Jan. 22 2018 13384 8.030 50 Jan. 23 2018 10680 6.408 43 Jan. 24 2018 11283 6.770 45 Jan. 25 2018 17194 10.316 22 Jan. 26 2018 6445 3.867 21 Jan. 2018 6132 3.679 20 Jan. 28 2018 6315 3.789 22 Jan. 29 2018 11538 6.923 34 Jan. 30 2018 13183 7.910 51 Jan. 31 2018 11820 7.092 32 68 67 68 69 69 70 68 69 67 67 Jan. Sleep 7.4667 4.9833 1.2000 8.1167 8.9667 7.0667 4.7833 6.7500 4.4833 5.5667 5.2833 7.5333 8.9000 6.7500 4.6667 6.7500 6.0000 6.4833 8.9667 8.5500 5.0333 3.1833 4.9500 8.0833 5.1000 9.4333 8.2167 6.4833 5.3667 4.3667 6.2833 16 68 Jan. 68 67 68 65 65 64 63 64 64 67 65 62 60 60 62 27 Totals Steps Distance 323280 193.968 Floors Sleep (hours) 886 195.7667 Min values: Sleep (hours) : 1.20 Steps: 5033.00 Floors climbed: 13.00 Mean/Average values: Sleep (hours) : 6.32 Steps: 10428.39 Floors climbed: 28.58 Max values: Sleep (hours): 9.43 Steps: 17194.00 Floors climbed: 51.00 fx >> Rev 2 Problem and Program Details: We are building off of your work from Rev. 1, so copy and paste your solution from Rev 1 and rename it to Assign4R2_.m where is your CCID. Next, edit line 15, for i=1:31%For Rev 1 31, For Rev 2 size (Data, 2) to for i=1:size (Data, 2) For Rev 1 31, For Rev 2 size (Data,2) Uncomment the these two lines in the main function Monthly=ConvertAndSum_Monthly (Totals); %PrintAndSaveDataMonthly (Monthly); Uncomment the last two functions in the file. Then create a new monthly summary of the created structure array into a new structure array where you have the following fields: Month, Year, Total number of steps, distance, floors, sleep, and average resting heart rate. Save this new summarized result as Monthly.mat You will need this data to display the monthly results to the command window. Then display the contents of the new structure array to the command window with a title and your name with your CCID. Along with the totals for the month of sleep, steps, distance, floors climbed, and average resting heart rate. Other stats that may be useful to the client are minimum, mean (or average) and maximum values of sleep, steps, and floors climbed. Your output should look similar to the output of Rev2.p Code requirements For part B, you must use functions to accomplish this task, when displaying data to the command window you must use fprintf. function. Please use the provided skeleton code as your starting point. Also, when submitting your solution there is only 1 file to be submitted, this file will contain all the functions to solve this assignment. Checklist: Did you save your data using your full name as the filename with the extension .mat? This should contain 365 rows of data Did you save your monthly totals using Monthly.mat as your filename, This should contain 12 row of data Did you create the plots? Did you include the titles and labels Did you display the data to the command window? Does is data match what is included in the screenshot (not including your Full name and CCID) - Did you display the title along with your Full name and CCID? Did you use functions to solve this problem? Did you comment your code? Do you have descriptive variable names? Did you credit any student who helped you? %10ad data file, this data file needs to be in the same location as *. m %file load('Data_Year. mat'); %display a tile fprintf('ENCMP100 Assignment #4A Fitness Data Display '); %For Rev 1 %fprintf('ENCMP100 Assignment #4B Fitness Data Display '); %For Rev 2 fprintf('Anaylsed by '); % display who created program for i=1:31%For Rev 1 31, For Rev 2 size (Data, 2) Totals (i, :)=ConvertAndSum (Data (i)); end GenPlots (Totals); Stats=GenStats (Totals); PrintData (Totals, Stats); %save data as a *. mat file ... filename to be student name. mat save('. mat','Totals'); %Monthly=ConvertAndSum_Monthly (Totals); %PrintAndSaveDataMonthly Monthly); end function [Totals] = ConvertAndSum (Data) %Function ConvertAndSum: takes in a structure array Data, does some simple calculations and saves it into a new %structure array called Totals. end function [] =Genplots (Totals) %Function GenPlots: takes the values in a structure array called Totals and %plots 4 charts on one chart using subplot. end function (Stats] =GenStats (Totals) %Function: GenStats: generate stats like min., mean, and max. values of steps, sleep, floors climbed %returns values in a array caled Stats. end E function []=PrintData (Totals, Stats) %Function PrintData: prints a display from the data contained in the structure array Totals, and array Stats end function (Monthly] = ConvertAndSum Monthly (TotalsDaily) %Function ConvertAndSum_Monthly: converts the structure array Total (which should contain -%the daily totals for a year) to a monthly summary of results end function ()=PrintAndSaveDataMonthly (TotalsMonth) %Function PrintAndSaveDataMonthly: display Monthly summarized results to the command window %and a text file using the fopen, fprintf and fclose functions end


