

Question: Steps 1 . Read scenario and approach. 2 . In Activity 1 you will need to forecast for each month of Year 2 , beginning
Steps
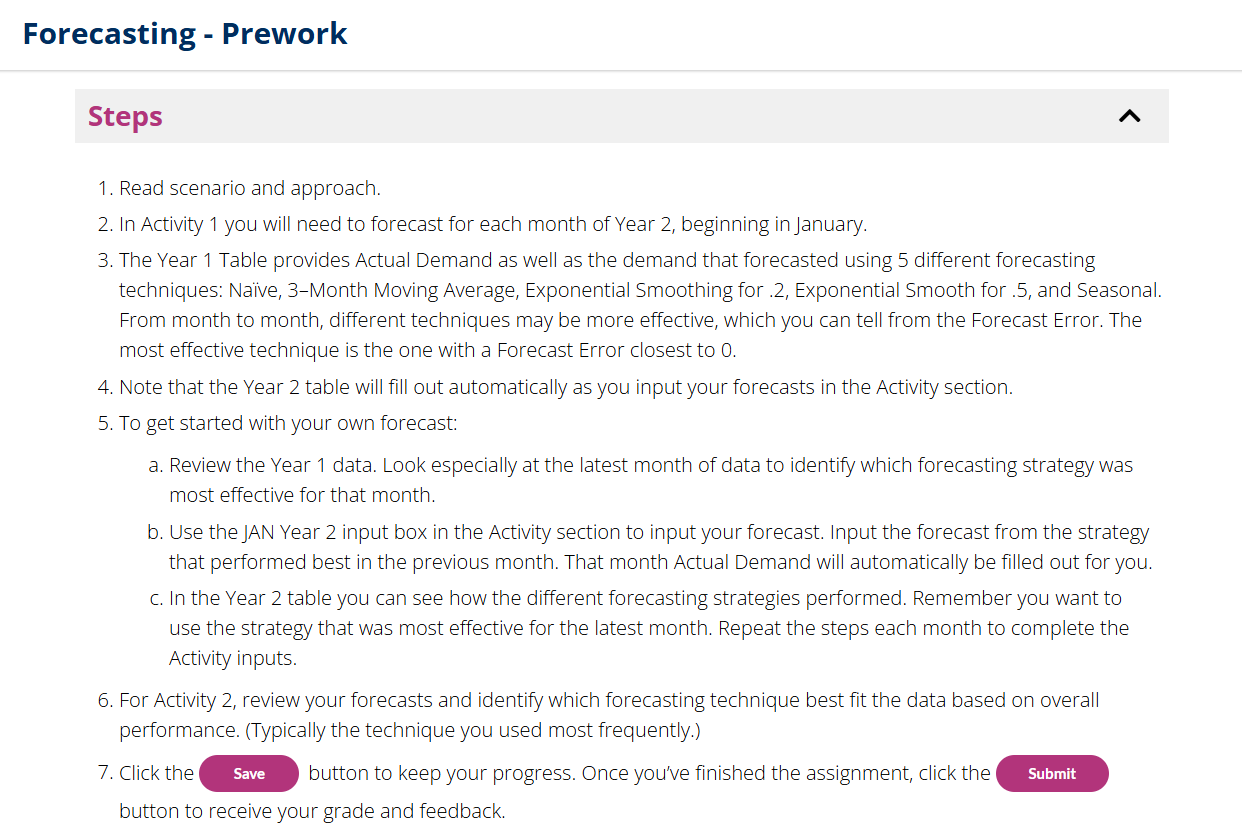
Read scenario and approach.
In Activity you will need to forecast for each month of Year beginning in January.
The Year Table provides Actual Demand as well as the demand that forecasted using different forecasting techniques: NaveMonth Moving Average, Exponential Smoothing for Exponential Smooth for and Seasonal. From month to month, different techniques may be more effective, which you can tell from the Forecast Error. The most effective technique is the one with a Forecast Error closest to
Note that the Year table will fill out automatically as you input your forecasts in the Activity section.
To get started with your own forecast:
a Review the Year data. Look especially at the latest month of data to identify which forecasting strategy was most effective for that month.
b Use the JAN Year input box in the Activity section to input your forecast. Input the forecast from the strategy that performed best in the previous month. That month Actual Demand will automatically be filled out for you.
c In the Year table you can see how the different forecasting strategies performed. Remember you want to use the strategy that was most effective for the latest month. Repeat the steps each month to complete the Activity inputs.
For Activity review your forecasts and identify which forecasting technique best fit the data based on overall performance. Typically the technique you used most frequently.
Click the I
I button to keep your progress. Once you've finished the assignment, click the button to receive your grade and feedback. Scenario
You have been given a task to create a demand forecast for the second year of sales of a premium outdoor grill. Accurate forecasts are important for many reasons, including for the company to ensure they have the materials they need to create the products required in a certain period of time. Your objective is to minimize the forecast error, which will be measured using the Mean Absolute Percentage Error MAPE with a goal of being below
You have historical monthly sales data for the past year and access to software that provides forecasts based on five different forecasting techniques NaveMonth Moving Average, Exponential Smoothing for Exponential Smooth for and Seasonal to help determine the best forecast for that particular month. Based on the given data, you will identify trends and patterns to create a more accurate forecast.
Approach
Consider the previous month's forecast to identify which technique is most effective. Use that to forecast the next month.
Remember to select the forecasting technique that produces the forecast error nearest to zero. For example:
a Nave Forecast is and the Forecast Error is
bMonth Moving Forecast is and the Forecast Error is
c Exponential Smoothing Forecast for is and the Forecast Error is
d Exponential Smoothing Forecast for is and the Forecast Error is
e Seasonal Forecast is and the Forecast Error is
The forecast for the next month would be as the Nave Forecast had the Forecast Error closest to zero with a This forecasting technique was the best performing technique for that month. You do not need to do any external analysisthe forecast error for each strategy is already calculated for you in the tables below. begintabularccccccccccccc
hline lonth & Period & Actual Demand & Nave & begintabularl
Nave
Forecast
Error
endtabular & begintabularl
Month
Moving
Forecast
endtabular & begintabularl
Month
Moving
Forecast
Error
endtabular & begintabularl
Exponential
Smoothing
Forecast
for
endtabular & Exponential Smoothing Forecast Error & begintabularl
Exponential
Smoothing
Forecast
for
endtabular & begintabularl
Exponential
Smoothing
Forecast
Error
endtabular & Seasonal & begintabularl
Seasor
Foreca
Errol
endtabular
hline multicolumnl Year
hline JAN & & & & & & & & & & & &
hline FEB & & & & & & & & & & & &
hline VAR & & & & & & & & & & & &
hline APR & & & & & & & & & & & &
hline MAY & & & & & & & & & & & &
hline JUN & & & & & & & & & & & &
hline JUL & & & & & & & & & & & &
hline AUG & & & & & & & & & & & &
hline jEPT & & & & & & & & & & & &
hline OCT & & & & & & & & & & & &
hline VOV & & & & & & & & & & & &
hline DEC & & & & & & & & & & & &
hline multicolumnl Year
Activity : Year Forecast
begintabularcccccccc
hline multirowtForecast next period & multirowYear & multirowMAPE & multirowtAverage MAPE & multicolumncActual Demand & multirowbSeasonal Index
hline & & & & Month & Year & Year &
hline JAN & & & & JAN & & &
hline FEB & & & & FEB & & &
hline MAR & & & & MAR & & &
hline APR & & & & APR & & &
hline MAY & & & & MAY & & &
hline JUN & checkmark & & & JUN & & &
hline JUL & & & & JUL & & &
hline AUG & & & & AUG & & &
hline SEPT & checkmark & & & SEPT & & &
hline OCT & & & & OCT & & &
hline NOV & cdot & & & NOV & & &
hline DEC & & & & DEC
Step by Step Solution
There are 3 Steps involved in it
1 Expert Approved Answer
Step: 1 Unlock

Question Has Been Solved by an Expert!
Get step-by-step solutions from verified subject matter experts
Step: 2 Unlock
Step: 3 Unlock