Question: I need help to solve it please as soon as possible. AutoSave Off He HW1&2_SPRING_2021Version 1 (3) - Excel Search Rachid Sarhane RS File Home
 I need help to solve it please as soon as possible.
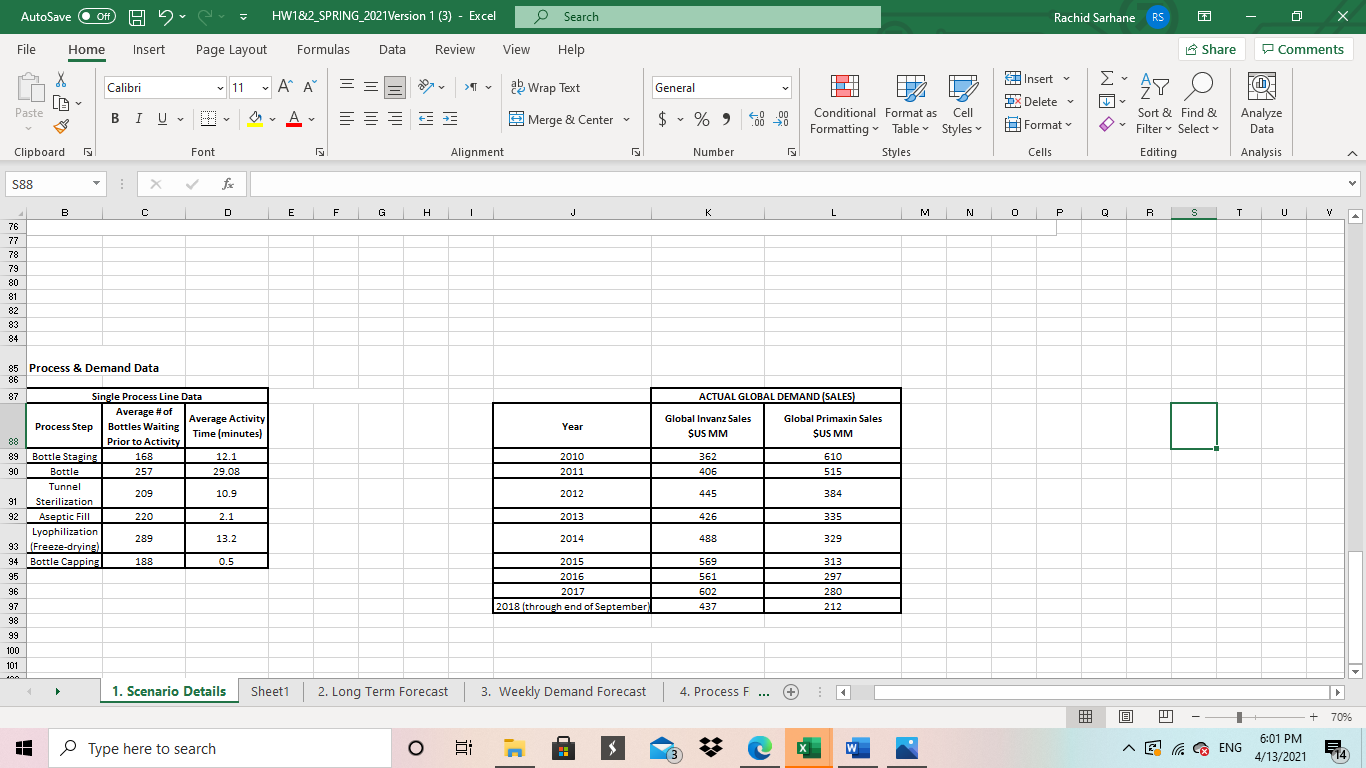
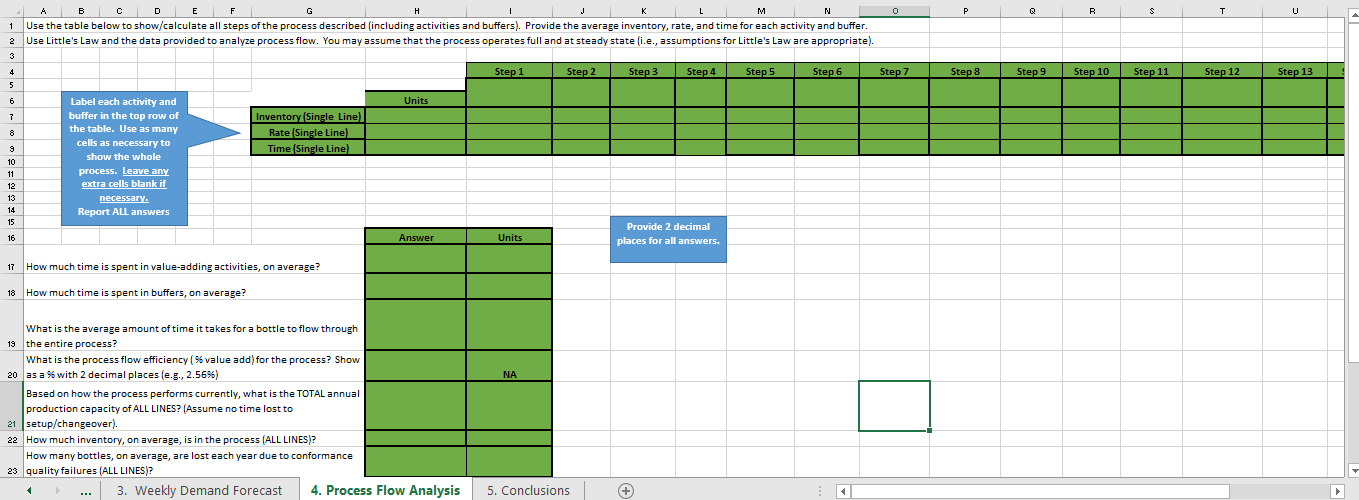
AutoSave Off He HW1&2_SPRING_2021Version 1 (3) - Excel Search Rachid Sarhane RS File Home Insert Page Layout Formulas Data Review View Help Share Comments 1 Calibri 11 | A? = = > ab Wrap Text General AY FO Insert 3X Delete Format Paste .00 BIU A 3 Merge & Center $ % 40 .00 Conditional Format as Cell Formatting Table Styles Styles Sort & Find & Filter Select Analyze Data Clipboard Font Alignment Number Cells Editing Analysis S88 X B E F G H I J K L N P Q R S . 76 77 78 79 80 81 82 83 84 85 Process & Demand Data 86 ACTUAL GLOBAL DEMAND SALES Year Global Invanz Sales SUS MM Global Primaxin Sales SUS MM 2010 2011 362 406 610 515 2012 445 384 2013 426 335 87 Single Process Line Data Average # of Average Activity Process Step Bottles Waiting Time (minutes) 88 Prior to Activity 89 Bottle Staging 168 12.1 90 Bottle 257 29.08 Tunnel 209 10.9 91 Sterilization 92 Aseptic Fill 220 2.1 Lyophilization 289 13.2 93 (Freeze-drying| 94 Bottle Capping 188 0.5 95 96 97 98 99 100 101 2014 488 329 2015 2016 2017 2018 (through end of September 569 561 602 437 313 297 280 212 1. Scenario Details Sheet1 2. Long Term Forecast 3. Weekly Demand Forecast 4. Process F + 70% 11 O Type here to search o & . W AEC ENG 6:01 PM 4/13/2021 714 H 0 P Q R T U BC D E F M N 1 Use the table below to show/calculate all steps of the process described (including activities and buffers). Provide the average inventory, rate, and time for each activity and buffer. 2 Use Little's Law and the data provided to analyze process flow. You may assume that the process operates full and at steady state i.e., assumptions for Little's Law are appropriate). Step 1 Step 2 Step 3 Step 4 Step 5 Step 6 Step 7 Step 8 Step Step 10 Step 11 Step 12 Step 15 4 5 6 Units 7 7 8 Inventory Single Line Rate Single Line Time Single Line) 9 10 11 Label each activity and buffer in the top row of the table. Use as many cells as necessary to show the whole process. Leave any extra cells blank if necessary Report ALL answers 12 13 14 15 16 Answer Units Provide 2 decimal places for all answers. 17 How much time is spent in value-adding activities, on average? 18 How much time is spent in buffers, on average? NA What is the average amount of time it takes for a bottle to flow through 19 the entire process? What is the process flow efficiency (% value add) for the process? Show 20 as a % with 2 decimal places (e.g., 2.5696) Based on how the process performs currently, what is the TOTAL annual production capacity of ALL LINES? (Assume no time lost to 21 setup/changeover). 22 How much inventory, on average, is in the process (ALL LINES)? How many bottles, on average, are lost each year due to conformance 23 quality failures (ALL LINES)? 3. Weekly Demand Forecast 4. Process Flow Analysis 5. Conclusions + AutoSave Off He HW1&2_SPRING_2021Version 1 (3) - Excel Search Rachid Sarhane RS File Home Insert Page Layout Formulas Data Review View Help Share Comments 1 Calibri 11 | A? = = > ab Wrap Text General AY FO Insert 3X Delete Format Paste .00 BIU A 3 Merge & Center $ % 40 .00 Conditional Format as Cell Formatting Table Styles Styles Sort & Find & Filter Select Analyze Data Clipboard Font Alignment Number Cells Editing Analysis S88 X B E F G H I J K L N P Q R S . 76 77 78 79 80 81 82 83 84 85 Process & Demand Data 86 ACTUAL GLOBAL DEMAND SALES Year Global Invanz Sales SUS MM Global Primaxin Sales SUS MM 2010 2011 362 406 610 515 2012 445 384 2013 426 335 87 Single Process Line Data Average # of Average Activity Process Step Bottles Waiting Time (minutes) 88 Prior to Activity 89 Bottle Staging 168 12.1 90 Bottle 257 29.08 Tunnel 209 10.9 91 Sterilization 92 Aseptic Fill 220 2.1 Lyophilization 289 13.2 93 (Freeze-drying| 94 Bottle Capping 188 0.5 95 96 97 98 99 100 101 2014 488 329 2015 2016 2017 2018 (through end of September 569 561 602 437 313 297 280 212 1. Scenario Details Sheet1 2. Long Term Forecast 3. Weekly Demand Forecast 4. Process F + 70% 11 O Type here to search o & . W AEC ENG 6:01 PM 4/13/2021 714 H 0 P Q R T U BC D E F M N 1 Use the table below to show/calculate all steps of the process described (including activities and buffers). Provide the average inventory, rate, and time for each activity and buffer. 2 Use Little's Law and the data provided to analyze process flow. You may assume that the process operates full and at steady state i.e., assumptions for Little's Law are appropriate). Step 1 Step 2 Step 3 Step 4 Step 5 Step 6 Step 7 Step 8 Step Step 10 Step 11 Step 12 Step 15 4 5 6 Units 7 7 8 Inventory Single Line Rate Single Line Time Single Line) 9 10 11 Label each activity and buffer in the top row of the table. Use as many cells as necessary to show the whole process. Leave any extra cells blank if necessary Report ALL answers 12 13 14 15 16 Answer Units Provide 2 decimal places for all answers. 17 How much time is spent in value-adding activities, on average? 18 How much time is spent in buffers, on average? NA What is the average amount of time it takes for a bottle to flow through 19 the entire process? What is the process flow efficiency (% value add) for the process? Show 20 as a % with 2 decimal places (e.g., 2.5696) Based on how the process performs currently, what is the TOTAL annual production capacity of ALL LINES? (Assume no time lost to 21 setup/changeover). 22 How much inventory, on average, is in the process (ALL LINES)? How many bottles, on average, are lost each year due to conformance 23 quality failures (ALL LINES)? 3. Weekly Demand Forecast 4. Process Flow Analysis 5. Conclusions +


