

Question: Steps for Prepare a multiple - year trend graph for quality costs, both by total costs and by category in your own paper. Using the
Steps for
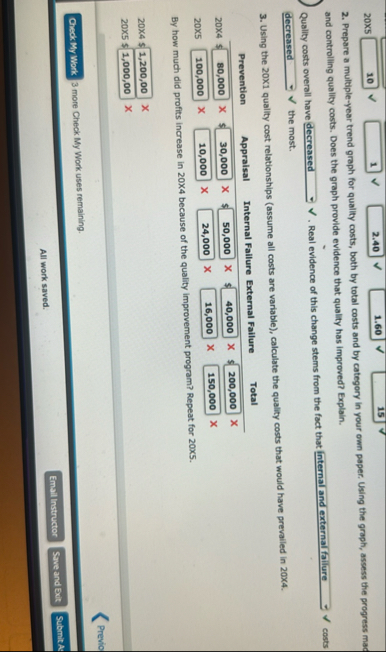
Prepare a multipleyear trend graph for quality costs, both by total costs and by category in your own paper. Using the graph, assess the progress mad and controlling quality costs. Does the graph provide evidence that quality has improved? Explain.
Qually costs overall have Real evidence of this change stems from the fact that internal and external fallure $ costs the most.
Using the quality cost relationships assume all costs are variable calculate the quality costs that would have prevailed in
tabletablePreventionAppraisalInternal FailureExternal FailureTotalX$x$Xx$xxxxxx
By how much did profits increase in because of the quality improvement program? Repeat for
Previo
more Check My Work uses remaining.
Save and Ext
Submit A
All work saved.
Step by Step Solution
There are 3 Steps involved in it
1 Expert Approved Answer
Step: 1 Unlock

Question Has Been Solved by an Expert!
Get step-by-step solutions from verified subject matter experts
Step: 2 Unlock
Step: 3 Unlock