

Question: Steps to approach and solve this question WITHOUT TUKEYS test I know the answer is d, I'm not sure how to get there, we have
Steps to approach and solve this question WITHOUT TUKEYS test
I know the answer is d, I'm not sure how to get there, we have learnt Sums of Squares calculations
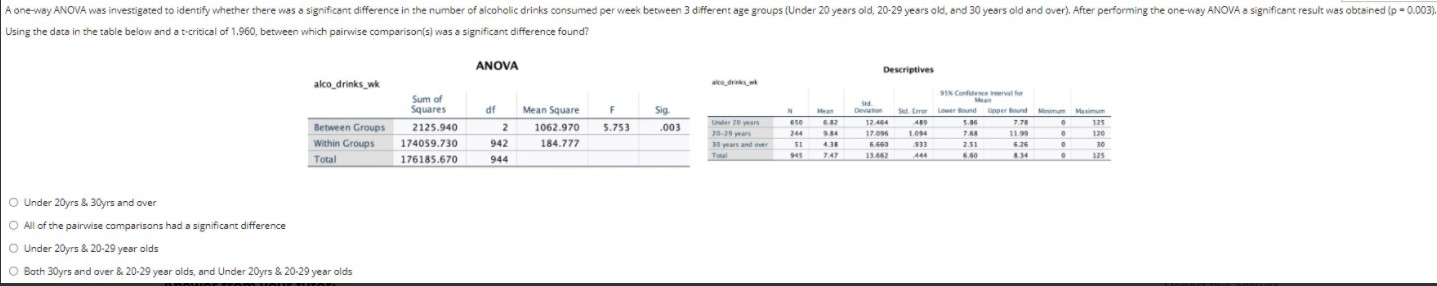
A one-way ANOVA was investigated to identify whether there was a significant difference in the number of alcoholic drinks consumed per week between 3 different age groups (Under 20 years old, 20-29 years old, and 30 years old and over). After performing the one-way ANOVA a significant result was obtained (p = 0.003) Using the data in the table below and a t-critical of 1.960, between which pairwise comparison(s) was a significant difference found? ANOVA Descriptives alco_drinks_wk 95% Confidence Inserval for Sum of Squares df Mean Square Sig Deviation Upper Bound 5.86 7:78 2125.940 5.753 003 Under 20 years 650 6.82 12.464 125 1062.970 459 Between Groups 20-29 years 244 17.095 1.094 7.68 11.99 120 Within Groups 174059.730 942 184.777 30 years and Gutt 4.35 6.650 933 2.51 6.26 0 30 945 444 6.50 8 34 125 Total 176185.670 944 13.462 O Under 20yrs & 30yrs and over O All of the pairwise comparisons had a significant difference O Under 20yrs & 20-29 year olds Both 30yrs and over & 20-29 year olds, and Under 20yrs & 20-29 year olds
Step by Step Solution
There are 3 Steps involved in it

Get step-by-step solutions from verified subject matter experts