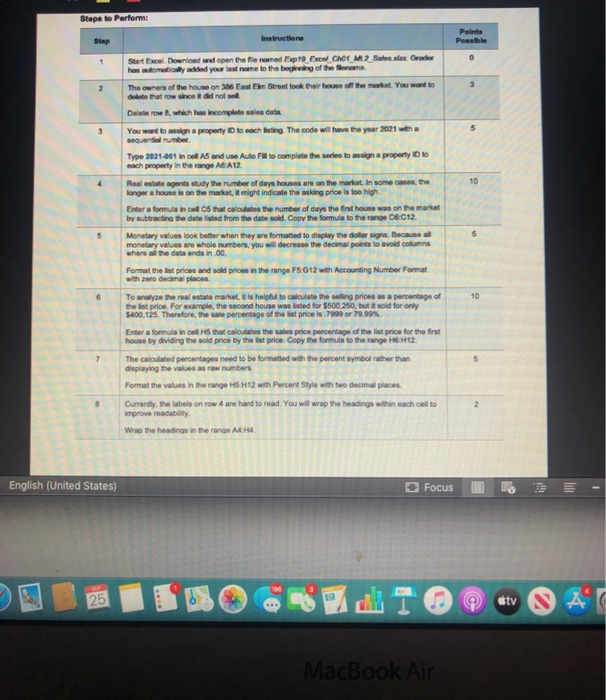
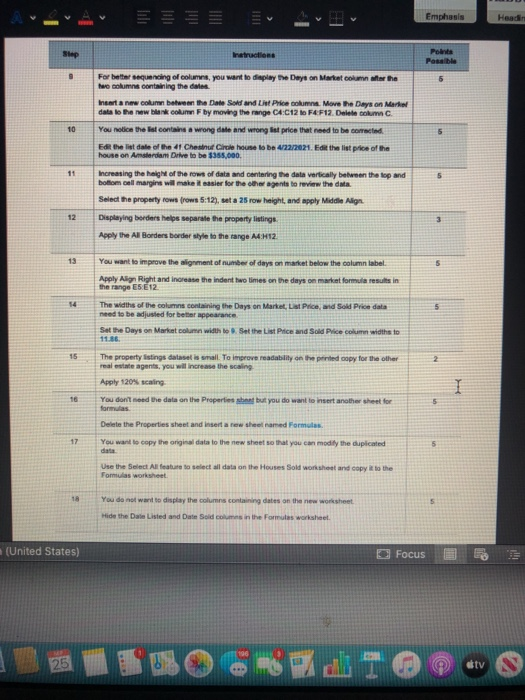
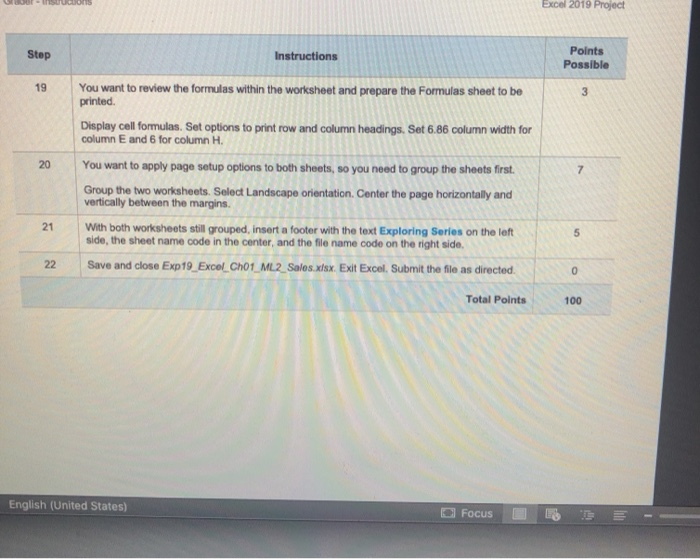
Question: Steps to Parform: Point Possible Step Instruction 1 3 5 10 5 Start Excel Download wd open the flowed Expt9 E CHOR ME? Sesex Gruder
Steps to Parform: Point Possible Step Instruction 1 3 5 10 5 Start Excel Download wd open the flowed Expt9 E CHOR ME? Sesex Gruder has wordded your own to the beginning of the me The owner of the house on 386 En Street took their home of the market. You want to delete that we did not Delete row, which has incomplete sales data You want to main property to each listing. The code will have the year 2001 with a sequential number Type 2021-C01 in coll AS and Use Auto Fulto complete the series to analyn a property is to each property in the range A A12 Real estate agents wudy the number of days houses are on the market. In some cases, the longer a house is on the market, it might indicate the asking price is too high Enter a formula in od that calculates the number of days the first house was on the market by subtracting the date listed from the date sold. Copy the formula to the range 06.012 Monetary values look better when they are formatted to display the dollar sign, Because monetary values are whole numbers, you will decrease the decimal points to avoid columns where the data ends in.00 Format the list prices and sold prices in the range F5.612 with Accounting Number Format with zero decimal places. To analyze the real estate market. It is helpful to calculate the selling prices as a percentage of the list price. For example, the second house was listed for $500.250, but it sold for only $400,125. Therefore, the sale percentage of the list price is 7990 or 79.99% Enter a formula in cel HS that calculates the sales price percentage of the list price for the first house by dividing the sold price by the list price. Copy the formula to the range H6H12. The calculated percentages need to be formatted with the percent symbol rather than displaying the values as raw numbers Format the values in the range HS.H12 with Percent Style with two decimal places. Currently, the labels on row 4 are hard to read. You will wrap the headings within each cell to improve readability Wrap the headings in the range AA.H. 10 7 8 2 English (United States) Focus 25 stv AT MacBook Air Emphasis Header Step Instructions Points Possible 5 10 For better sequencing of columns, you want to display the Days on Market column to the the solumns containing the dates Insert a new col between the Date Sold and the Price come Move the Days on Market data to the new blank column F by moving the range CA:C12 to F4F12. Delete column C. You notice the list contain a wrong date and wrong ist price that need to be corrected Edit the list date of the 41 Chestnut Circle house to be 472272021. Edit the list price of the house on Amsterdam Drive to be $355,000 Increasing the haght of the rows of data and centering the data vertically between the top and bottom cell margins will make it easier for the other agents to review the data. Select the property towarows 5:12), set a 25 row height, and apply Middle Align Displaying borders helps separate the property listings Apply the Al Borders border wyle to the range AH12 11 12 13 5 You want to improve the lignment of number of days on market below the column label Apply Alon Right and increase the indent bwo times on the days on market formula results in the range E5E12 The widths of the columns containing the Days on Market, List Price, od Sok Price data need to be adjusted for better appearance Set the Days on Market column width to set the List Price and Sold Price column widths to 6 11.86 15 2 I The property listings dataset is small. To improve readability on the printed copy for the other real estate agents, you will increase the scaling Apply 120% scaling You don't need the data on the Properties shant but you do want to insert another sheet for formulas Delete the Properties sheet and heart raw the ramed Formulas. You want to copy the original data to the new sheets that you can modify the duplicated 17 Use the Select All feature to select all data on the House Sold worksheet and copy to the Formulas worksheet 18 5 You do not want to display the columns containing dates on the new worksheet Hide the Date Listed and Date Sold columns in the Formulas worksheet (United States) O Focus 25 0O 6-8 P1 @ tv Excel 2019 Project Step Instructions Points Possible 19 3 20 7 You want to review the formulas within the worksheet and prepare the Formulas sheet to be printed Display cell formulas. Set options to print row and column headings, Set 6.86 column width for column E and 6 for column H. You want to apply page setup options to both sheets, so you need to group the sheets first. Group the two worksheets. Select Landscape orientation Center the page horizontally and vertically between the margins. With both worksheets still grouped insert a footer with the text Exploring Series on the left side, the sheet name code in the center, and the file name code on the right side. Save and close Exp19_Excel_Ch01_ML2_Sales.xlsx. Exit Excel. Submit the file as directed. 21 5 22 0 Total Points 100 English (United States) Focus Steps to Parform: Point Possible Step Instruction 1 3 5 10 5 Start Excel Download wd open the flowed Expt9 E CHOR ME? Sesex Gruder has wordded your own to the beginning of the me The owner of the house on 386 En Street took their home of the market. You want to delete that we did not Delete row, which has incomplete sales data You want to main property to each listing. The code will have the year 2001 with a sequential number Type 2021-C01 in coll AS and Use Auto Fulto complete the series to analyn a property is to each property in the range A A12 Real estate agents wudy the number of days houses are on the market. In some cases, the longer a house is on the market, it might indicate the asking price is too high Enter a formula in od that calculates the number of days the first house was on the market by subtracting the date listed from the date sold. Copy the formula to the range 06.012 Monetary values look better when they are formatted to display the dollar sign, Because monetary values are whole numbers, you will decrease the decimal points to avoid columns where the data ends in.00 Format the list prices and sold prices in the range F5.612 with Accounting Number Format with zero decimal places. To analyze the real estate market. It is helpful to calculate the selling prices as a percentage of the list price. For example, the second house was listed for $500.250, but it sold for only $400,125. Therefore, the sale percentage of the list price is 7990 or 79.99% Enter a formula in cel HS that calculates the sales price percentage of the list price for the first house by dividing the sold price by the list price. Copy the formula to the range H6H12. The calculated percentages need to be formatted with the percent symbol rather than displaying the values as raw numbers Format the values in the range HS.H12 with Percent Style with two decimal places. Currently, the labels on row 4 are hard to read. You will wrap the headings within each cell to improve readability Wrap the headings in the range AA.H. 10 7 8 2 English (United States) Focus 25 stv AT MacBook Air Emphasis Header Step Instructions Points Possible 5 10 For better sequencing of columns, you want to display the Days on Market column to the the solumns containing the dates Insert a new col between the Date Sold and the Price come Move the Days on Market data to the new blank column F by moving the range CA:C12 to F4F12. Delete column C. You notice the list contain a wrong date and wrong ist price that need to be corrected Edit the list date of the 41 Chestnut Circle house to be 472272021. Edit the list price of the house on Amsterdam Drive to be $355,000 Increasing the haght of the rows of data and centering the data vertically between the top and bottom cell margins will make it easier for the other agents to review the data. Select the property towarows 5:12), set a 25 row height, and apply Middle Align Displaying borders helps separate the property listings Apply the Al Borders border wyle to the range AH12 11 12 13 5 You want to improve the lignment of number of days on market below the column label Apply Alon Right and increase the indent bwo times on the days on market formula results in the range E5E12 The widths of the columns containing the Days on Market, List Price, od Sok Price data need to be adjusted for better appearance Set the Days on Market column width to set the List Price and Sold Price column widths to 6 11.86 15 2 I The property listings dataset is small. To improve readability on the printed copy for the other real estate agents, you will increase the scaling Apply 120% scaling You don't need the data on the Properties shant but you do want to insert another sheet for formulas Delete the Properties sheet and heart raw the ramed Formulas. You want to copy the original data to the new sheets that you can modify the duplicated 17 Use the Select All feature to select all data on the House Sold worksheet and copy to the Formulas worksheet 18 5 You do not want to display the columns containing dates on the new worksheet Hide the Date Listed and Date Sold columns in the Formulas worksheet (United States) O Focus 25 0O 6-8 P1 @ tv Excel 2019 Project Step Instructions Points Possible 19 3 20 7 You want to review the formulas within the worksheet and prepare the Formulas sheet to be printed Display cell formulas. Set options to print row and column headings, Set 6.86 column width for column E and 6 for column H. You want to apply page setup options to both sheets, so you need to group the sheets first. Group the two worksheets. Select Landscape orientation Center the page horizontally and vertically between the margins. With both worksheets still grouped insert a footer with the text Exploring Series on the left side, the sheet name code in the center, and the file name code on the right side. Save and close Exp19_Excel_Ch01_ML2_Sales.xlsx. Exit Excel. Submit the file as directed. 21 5 22 0 Total Points 100 English (United States) Focus