

Question: Stocks A & B have the expected returns and standard deviations shown in the table below: Asset Ae Be E(R) 25% 40% Std. deviation 40%
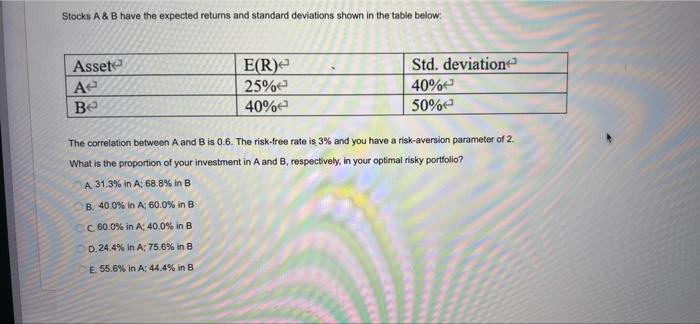
Stocks A & B have the expected returns and standard deviations shown in the table below: Asset Ae Be E(R) 25% 40% Std. deviation 40% 50% The correlation between A and B is 0.6. The risk-free rate is 3% and you have a risk-aversion parameter of 2. What is the proportion of your investment in A and B, respectively, in your optimal risky portfolio? A 31.3% in A: 68.8% in B B. 40.0% in A: 60.0% in B C. 60.0% in A: 40.0% in B D. 24.4% in A: 75.6% in B E. 55.6% in A: 44.4% in B
Step by Step Solution
There are 3 Steps involved in it
1 Expert Approved Answer
Step: 1 Unlock

Question Has Been Solved by an Expert!
Get step-by-step solutions from verified subject matter experts
Step: 2 Unlock
Step: 3 Unlock