

Question: straight line and plot . 0.30(a) Fit a second degree parabola of the type Y = a + bX + cx2 to the following data.
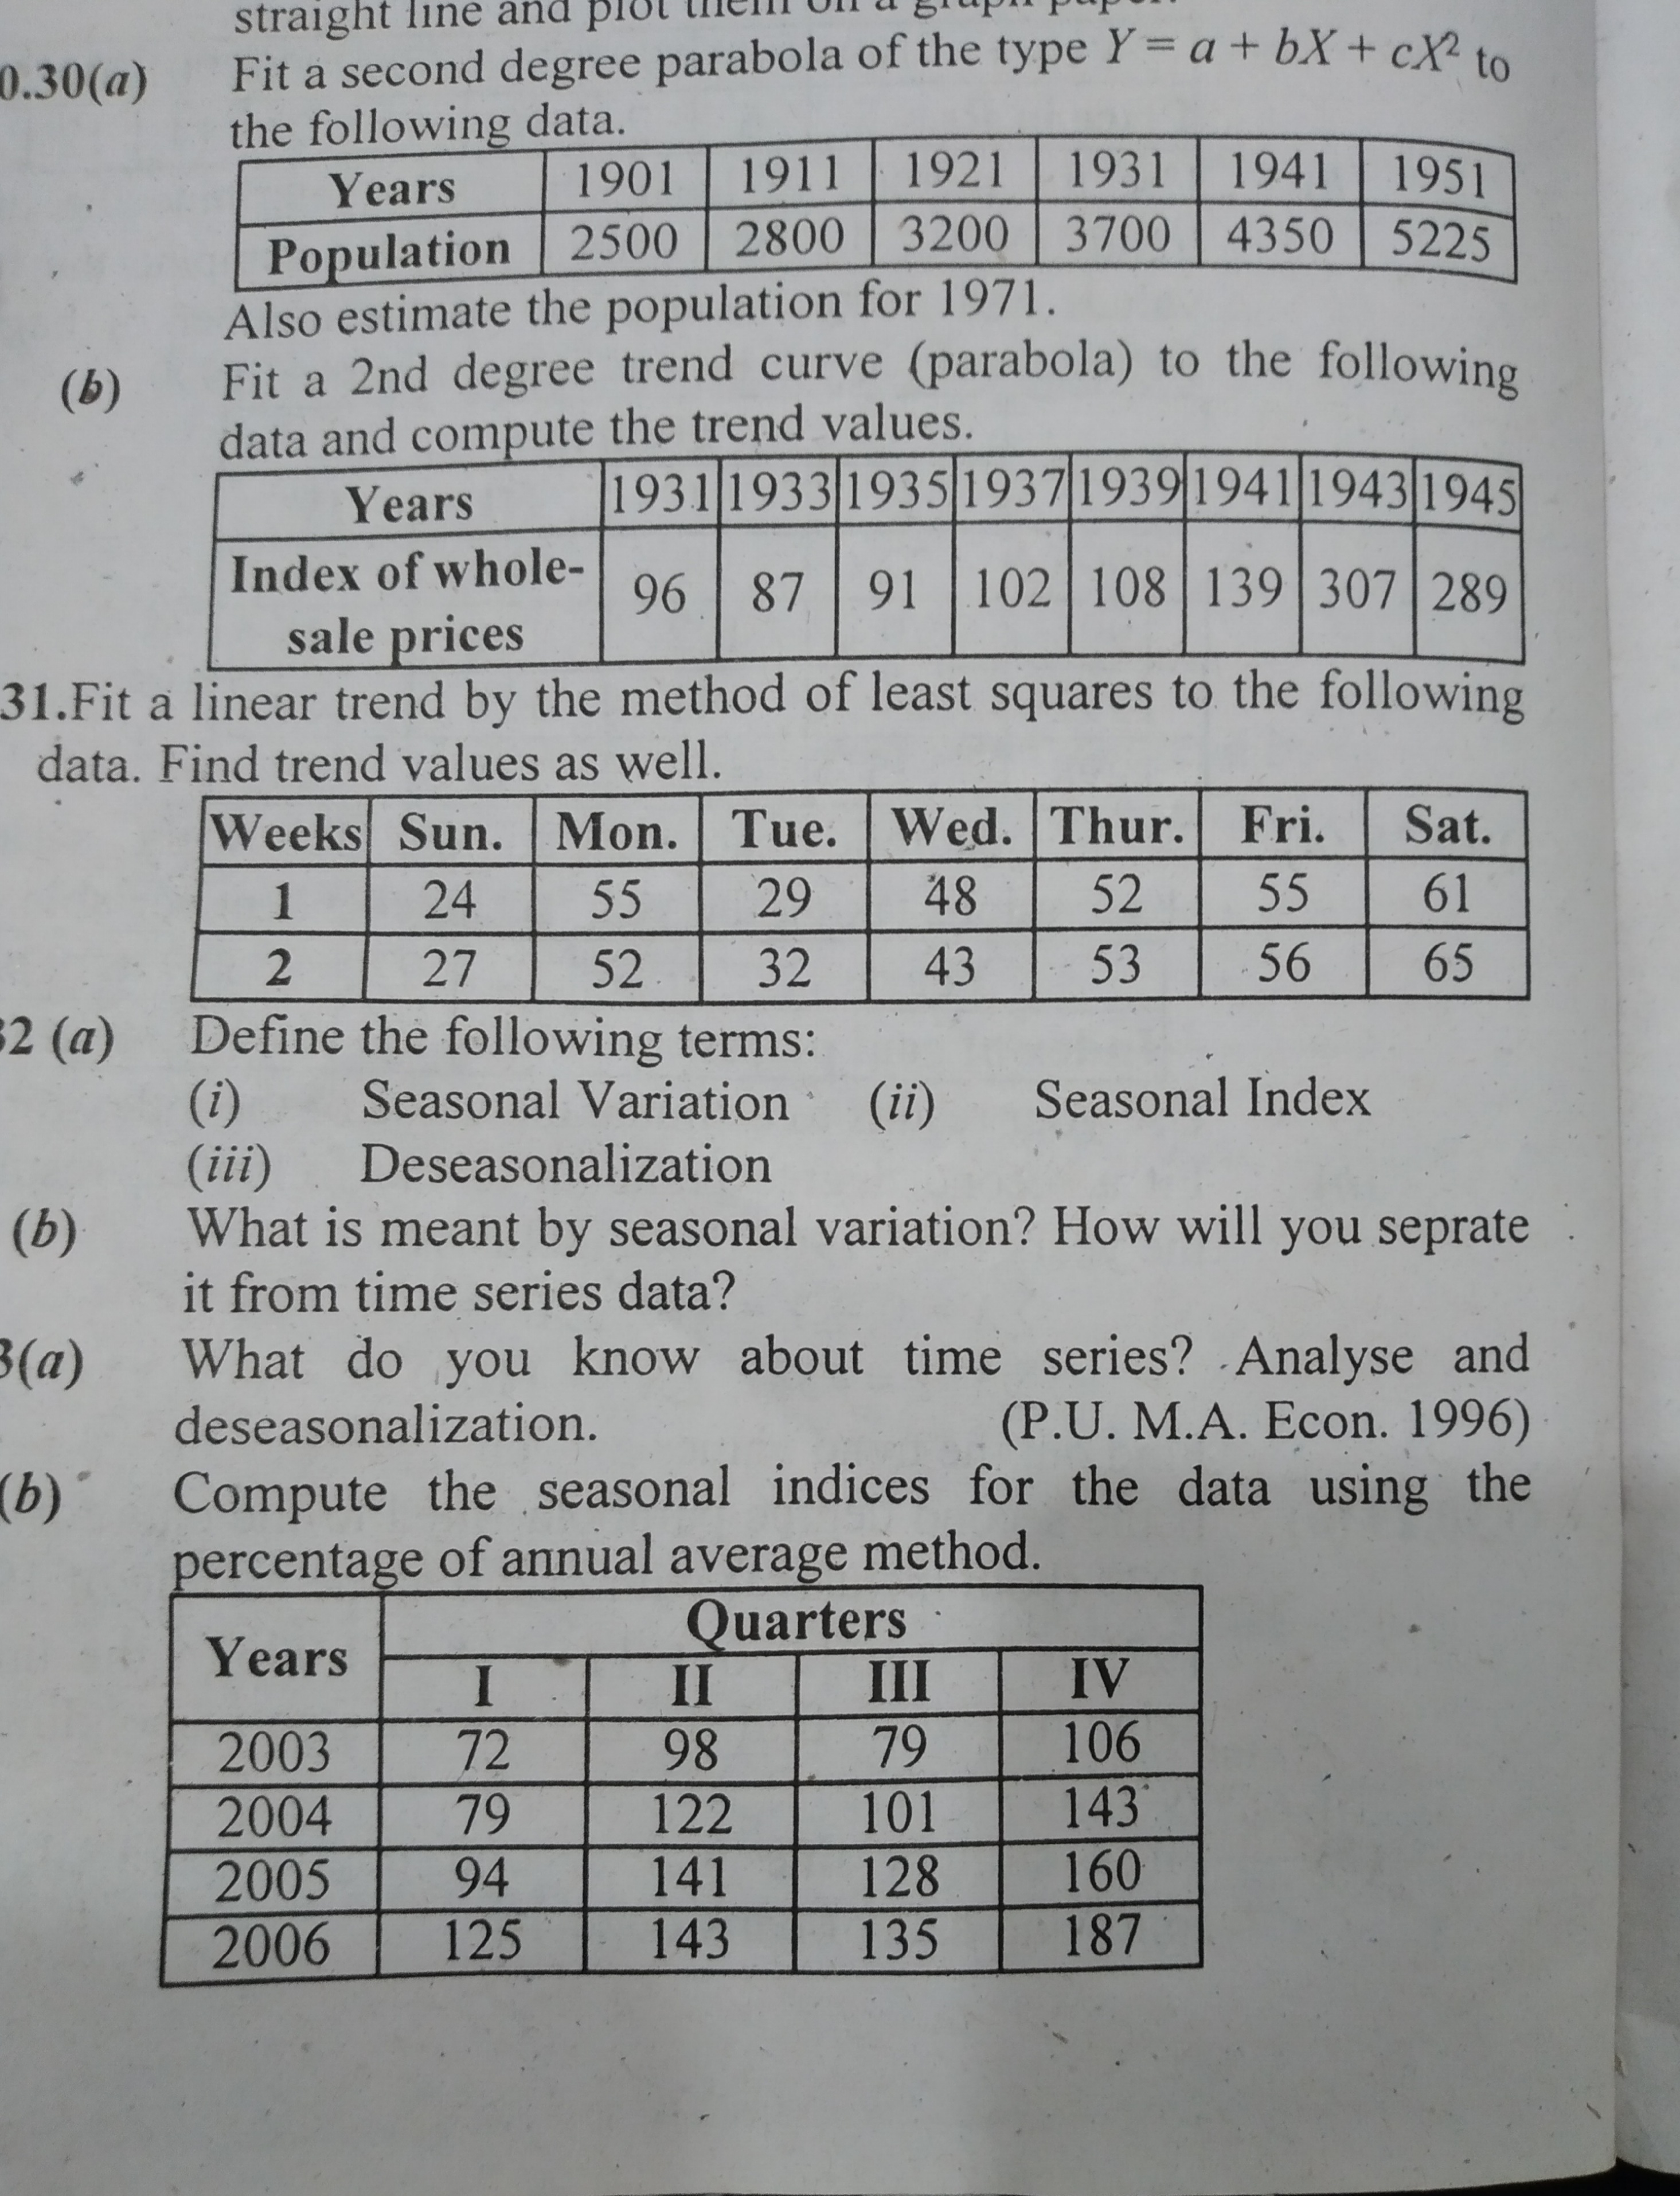
straight line and plot . 0.30(a) Fit a second degree parabola of the type Y = a + bX + cx2 to the following data. Years 1901 1911 1921 1931 1941 1951 Population 2500 2800 3200 3700 4350 5225 Also estimate the population for 1971. (b) Fit a 2nd degree trend curve (parabola) to the following data and compute the trend values. Years 1931 1933 1935 1937 1939 1941 1943 1945 Index of whole- 96 87 91 102 108 139 307 289 sale prices 31.Fit a linear trend by the method of least squares to the following data. Find trend values as well. Weeks Sun. Mon. Tue. Wed. Thur. Fri. Sat. 1 24 55 29 48 52 55 61 2 27 52 32 43 53 56 65 2 (a) Define the following terms: (i) Seasonal Variation . (ii) Seasonal Index (iii) Deseasonalization (b) What is meant by seasonal variation? How will you seprate it from time series data? 3(a) What do you know about time series? Analyse and deseasonalization. (P.U. M.A. Econ. 1996) b ) Compute the seasonal indices for the data using the percentage of annual average method. Years Quarters I II III IV 2003 72 98 79 106 2004 79 122 101 143 2005 94 141 128 160 2006 125 143 135 187
Step by Step Solution
There are 3 Steps involved in it

Get step-by-step solutions from verified subject matter experts