

Question: Stratified sampling Instead of drawing a sample completely at random, now you will draw stratified samples! Instructions: Download 'stratified sampling.xlsx'. This file will allow you
Stratified sampling
Instead of drawing a sample completely at random, now you will draw stratified samples!
Instructions:
- Download 'stratified sampling.xlsx'.
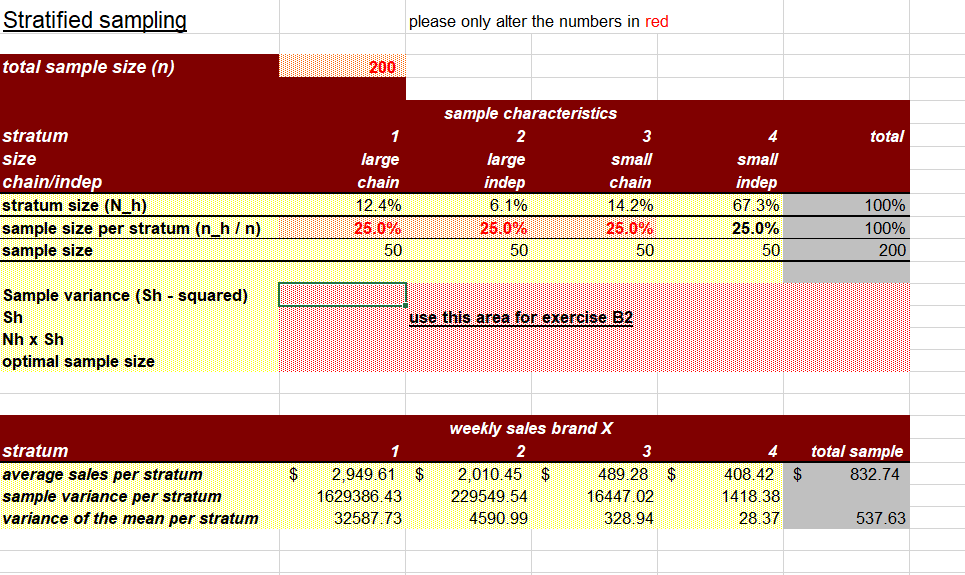
- This file will allow you to draw stratified samples of stores from four strata. The strata are defined based on store size and whether the store is a chain store or independent retailer.
- You can change the total sample size in cell C4, and the relative sample sizes in cells C11, D11, and E11. The population sizes are given in row 10 and the sample sizes are computed in row 12.
- After changing cells C4, C11, D11, and/or E11, you can sample new data by pressing Enter and resample by pressing F9.
- The sample means, sample variances, and variance of the means are computed in rows 22, 23, and 24. Values in columns C, D, E, and F are stratum specific, those in column G pertain to the whole sample.
1. Draw a sample of size 1000 (change the value in C4 if needed) with equal sample sizes per stratum (so 25% each). Report the sample mean and variance of the mean here
2. Given the same total sample size (n = 1000), compute the optimal sample sizes (see Lecture 6) and enter these below. Assume that the true variance is S21 = 1459264, S22 = 193600, S23 = 15876, and S24 = 1849 in stratum 1, 2, 3, and 4, respectively. The relative stratum sizes are given in the Excel file (N1/N = 12.4, N2/N = 6.1, N3/N = 14.2, N4/N = 67.3).
Hint: It is easiest to do the computations in four steps:
- compute the Sh = sqrt(S2h), for all strata h=1,2,3,4
- compute Nh x Sh for all strata h=1,2,3,4 (you can use the percentages). Note: you can just use the relative stratum sizes (Nh/N, instead of Nh). This will give you the same answer as using the absolute stratum sizes Nh.
- compute w = n / (N1 S1 + N2 S2 + N3 S3 + N4 S4).
- then compute the optimal sample sizes as : w x Nh x Sh.
You can use a calculator, or write the formulas in cells C14-G17 in the Excel file.
Step by Step Solution
There are 3 Steps involved in it

Get step-by-step solutions from verified subject matter experts