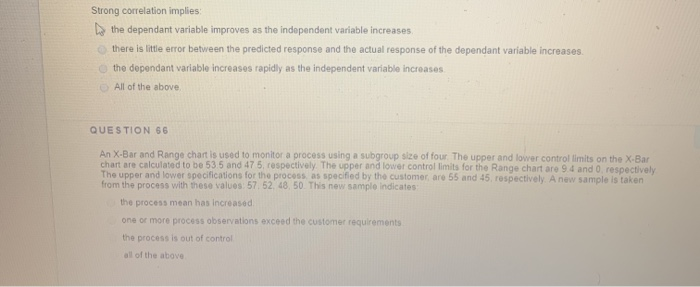
Question: Strong correlation implies: the dependant variable improves as the independent variable increases there is little error between the predicted response and the actual response of

Strong correlation implies: the dependant
Strong correlation implies: the dependant variable improves as the independent variable increases there is little error between the predicted response and the actual response of the dependant variable increases the dependant variable increases rapidly as the independent variable increases All of the above QUESTION 56 An X-Bar and Range chart is used to monitor a process using a subgroup size of four. The upper and lower control limits on the X-Bar chart are calculated to be 535 and 475, respectively. The upper and lower controllimits for the Range chart are 94 and 0. respectively The upper and lower specifications for the process as specified by the customer are 55 and 45. rospectively. A new sample is taken from the process with these values 57. 52, 48, 50. This new sample Indicatos the process mean has increased one or more process observations exceed the customer requirements the process is out of control all of the above

Step by Step Solution

There are 3 Steps involved in it

1 Expert Approved Answer
Step: 1 Unlock blur-text-image
Question Has Been Solved by an Expert!

Get step-by-step solutions from verified subject matter experts

Step: 2 Unlock
Step: 3 Unlock

Students Have Also Explored These Related General Management Questions!