

Question: Student Portal | UAGC | Univers X Week 2 - Assignment P Do Homework - Week 2 - Assic X Course Hero mylab.pearson.com/Student/PlayerHomework.aspx?homeworkId=656199932&questionId=9&flushed=false&cid=7521647&back=DoAssignments.aspx?view=homework MAT232:
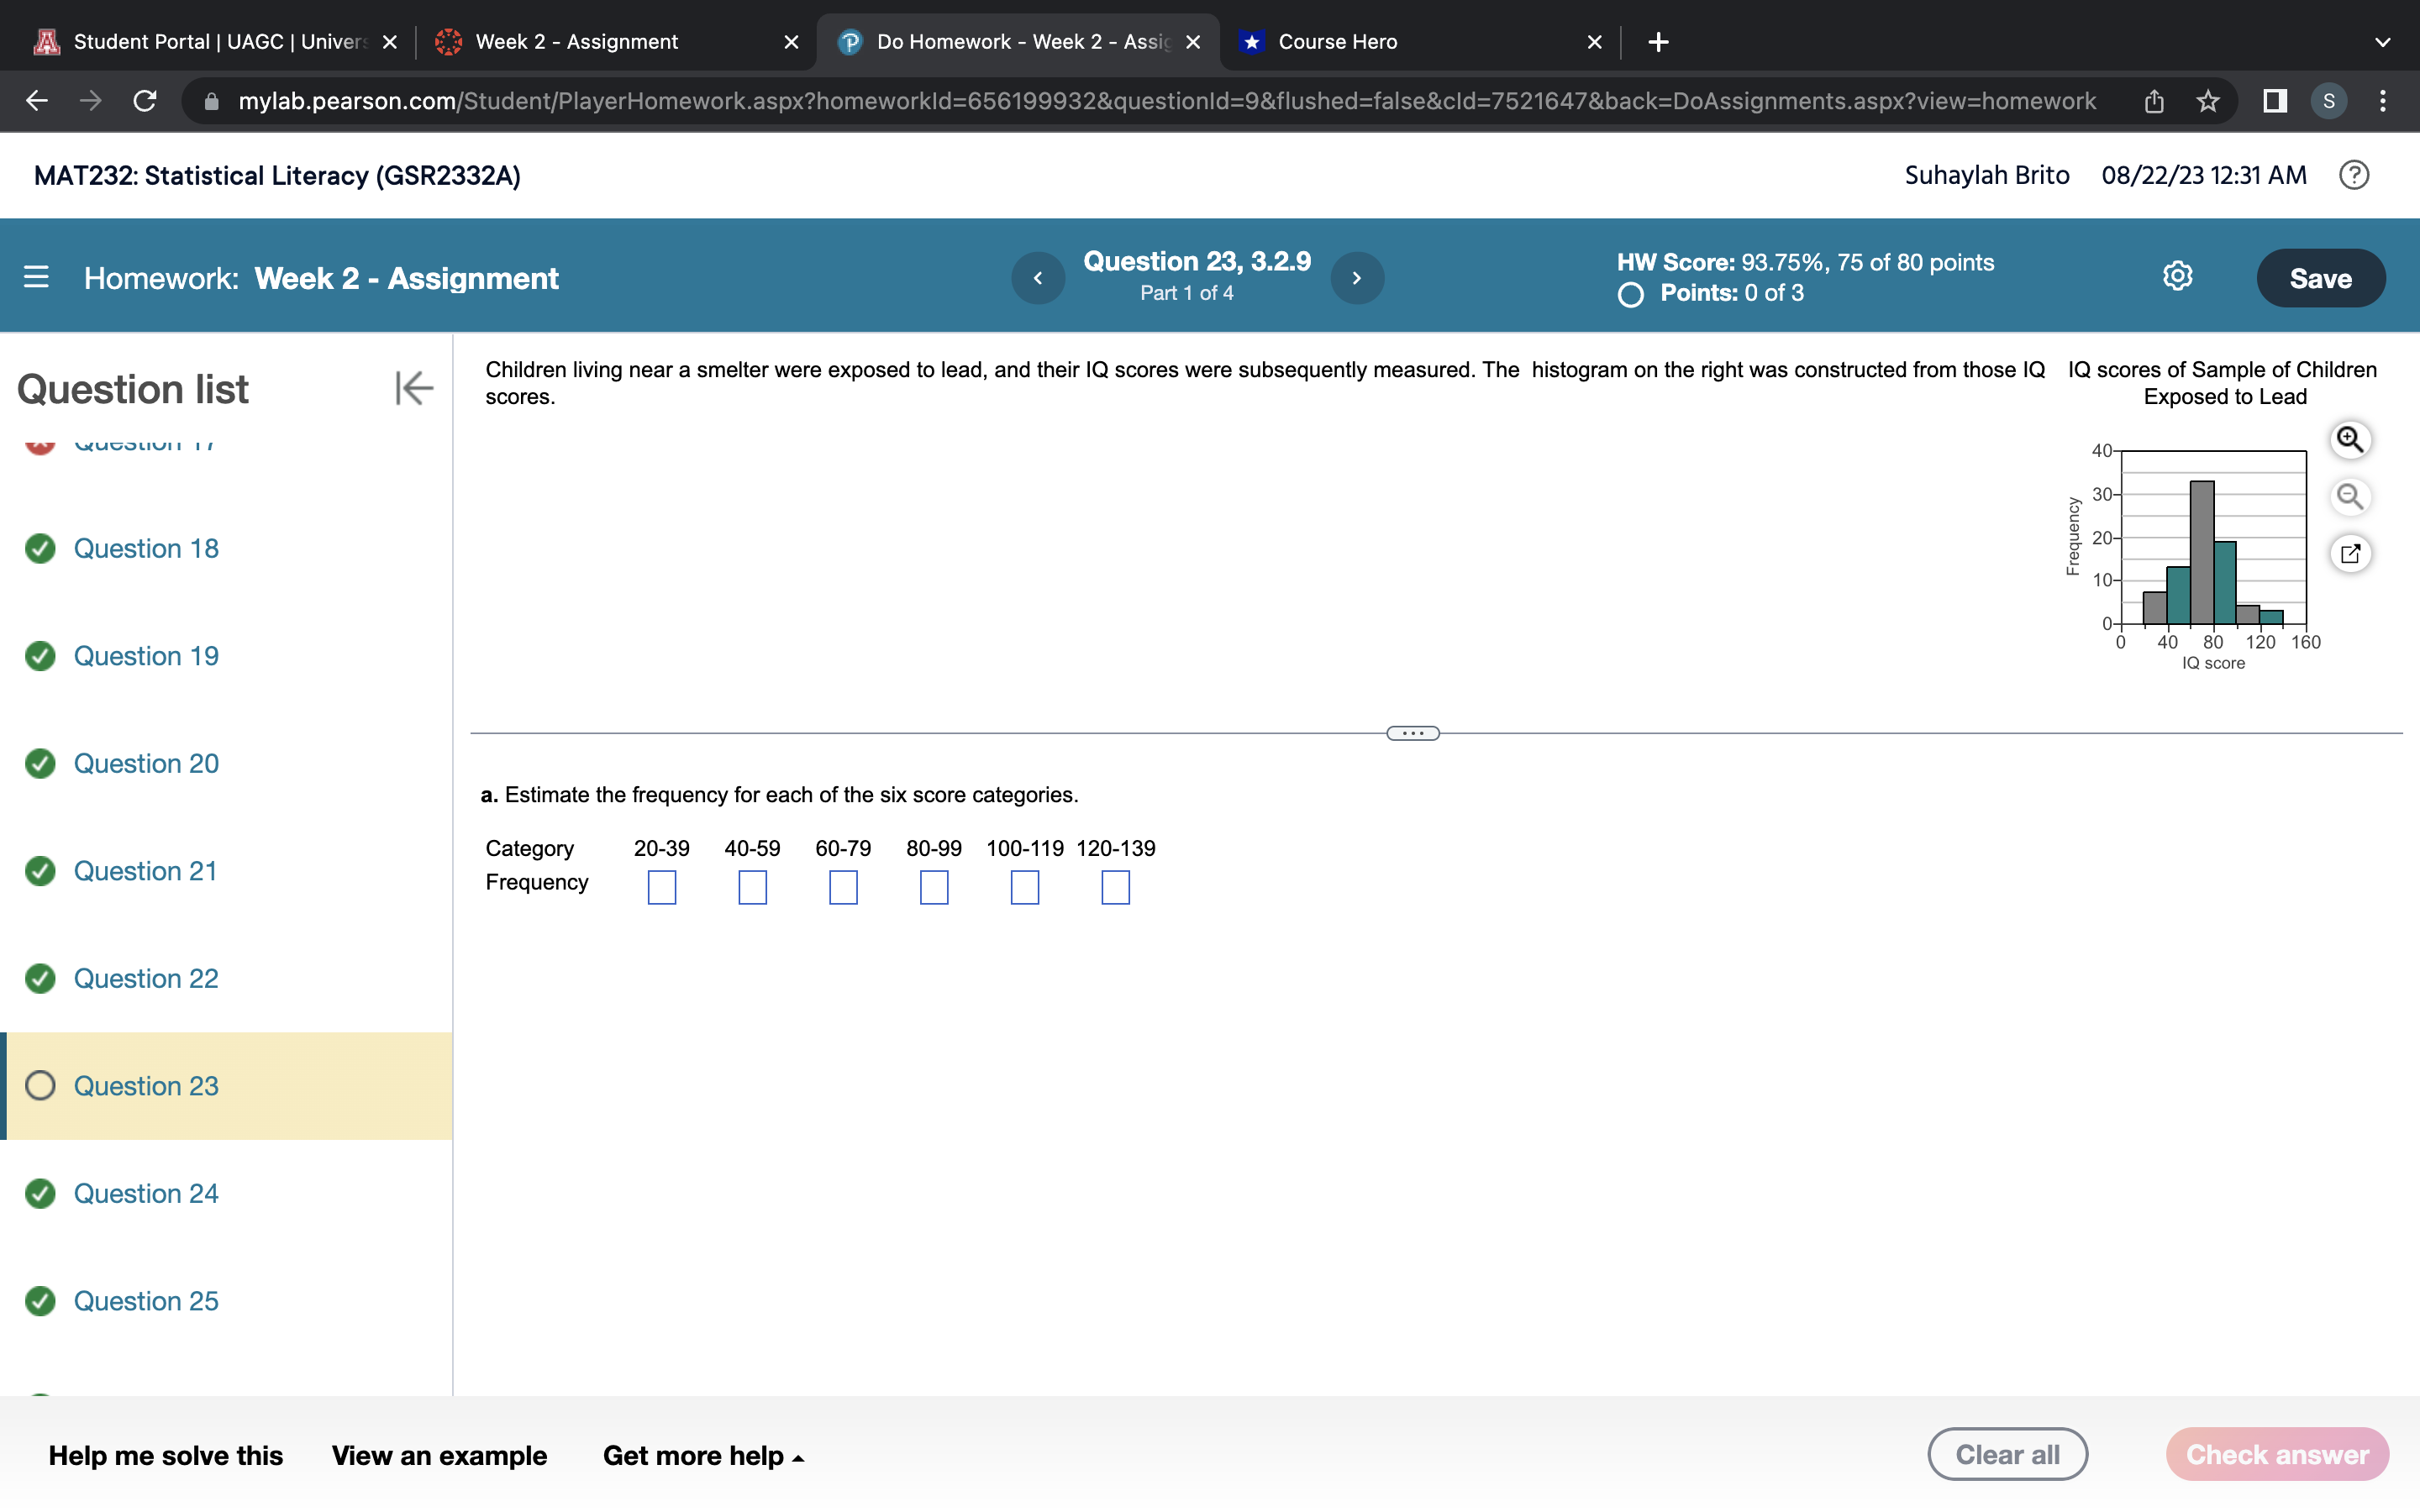
Student Portal | UAGC | Univers X Week 2 - Assignment P Do Homework - Week 2 - Assic X Course Hero mylab.pearson.com/Student/PlayerHomework.aspx?homeworkId=656199932&questionId=9&flushed=false&cid=7521647&back=DoAssignments.aspx?view=homework MAT232: Statistical Literacy (GSR2332A) Suhaylah Brito 08/22/23 12:31 AM = Homework: Week 2 - Assignment Question list K scores. QutbliUIT 17 Question 18 Question 19 Question 20 Question 21 Question 22 Question 23 Question 24 Question 25 < Question 23, 3.2.9 Part 1 of 4 > HW Score: 93.75%, 75 of 80 points Points: 0 of 3 S Save Children living near a smelter were exposed to lead, and their IQ scores were subsequently measured. The histogram on the right was constructed from those IQ IQ scores of Sample of Children Exposed to Lead a. Estimate the frequency for each of the six score categories. Category Frequency 20-39 40-59 60-79 80-99 100-119 120-139 Frequency 40- 30- 20- 10- 0+ 0 40 80 120 160 IQ score Help me solve this View an example Get more help Clear all Check answer
Step by Step Solution
There are 3 Steps involved in it

Get step-by-step solutions from verified subject matter experts