

Question: Student Template Provided Part 1: DDM - Multi-stage valuation Using resources available on the Internet, build a spreadsheet to calculate the intrinsic value of Microsoft
Student Template Provided
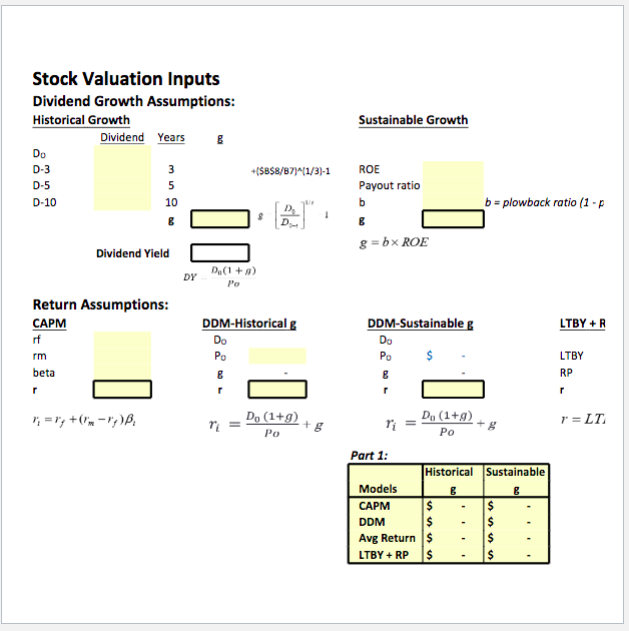
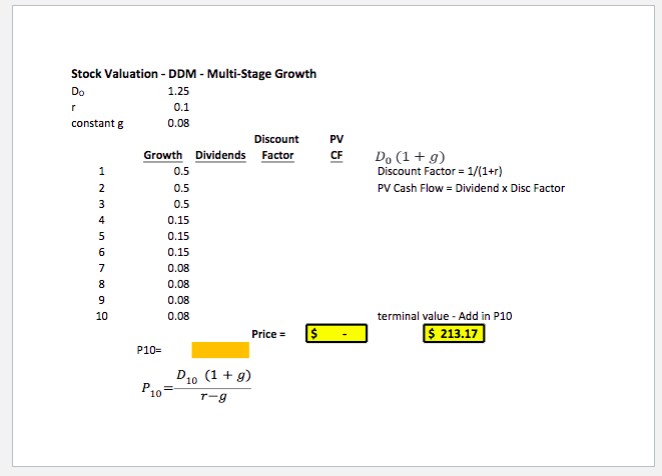
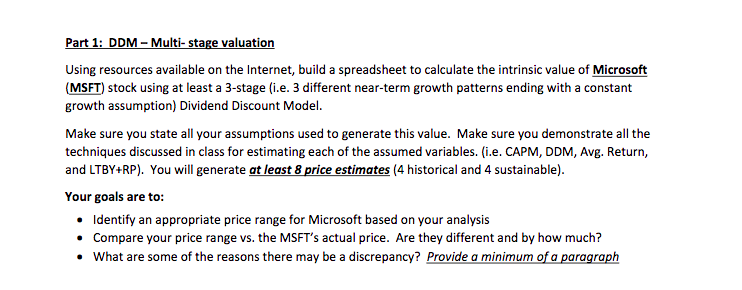
Part 1: DDM - Multi-stage valuation Using resources available on the Internet, build a spreadsheet to calculate the intrinsic value of Microsoft (MSFT) stock using at least a 3-stage (i.e. 3 different near-term growth patterns ending with a constant growth assumption) Dividend Discount Model. Make sure you state all your assumptions used to generate this value. Make sure you demonstrate all the techniques discussed in class for estimating each of the assumed variables. (i.e. CAPM, DDM, Avg. Return, and LTBY+RP). You will generate at least 8 price estimates (4 historical and 4 sustainable). Your goals are to: Identify an appropriate price range for Microsoft based on your analysis Compare your price range vs. the MSFT's actual price. Are they different and by how much? What are some of the reasons there may be a discrepancy? Provide a minimum of a paragraph Stock Valuation Inputs Dividend Growth Assumptions: Historical Growth Dividend Years & Sustainable Growth Do D-3 +($B$8/B7)^(1/3)-1 ROE Payout ratio D-10 b = plowback ratio (1-p C D & gbx ROE Dividend Yield Po Return Assumptions: CAPM DDM-Historical DDM-Sustainable g LTBY+R D. Po LTBY rm beta RP 7;=r; +('m) Do (1+g) Do (1+9) Po ri = " + g r=LT Po Part 1: Historical Sustainable Models CAPM DDM Avg Return LTBY + RP $ Stock Valuation - DDM - Multi-Stage Growth 1.25 Do 0.1 constant g 0.08 Growth Dividends Discount Factor PV CF 0.5 D. (1+9) Discount Factor = 1/(1+r) PV Cash Flow = Dividend x Disc Factor 0.5 0.5 HNM+in0002 ooooooo Price = $ . terminal value - Add in P10 $ 213.17 P10= D10 (1 + g) Por-g Part 1: DDM - Multi-stage valuation Using resources available on the Internet, build a spreadsheet to calculate the intrinsic value of Microsoft (MSFT) stock using at least a 3-stage (i.e. 3 different near-term growth patterns ending with a constant growth assumption) Dividend Discount Model. Make sure you state all your assumptions used to generate this value. Make sure you demonstrate all the techniques discussed in class for estimating each of the assumed variables. (i.e. CAPM, DDM, Avg. Return, and LTBY+RP). You will generate at least 8 price estimates (4 historical and 4 sustainable). Your goals are to: Identify an appropriate price range for Microsoft based on your analysis Compare your price range vs. the MSFT's actual price. Are they different and by how much? What are some of the reasons there may be a discrepancy? Provide a minimum of a paragraph Stock Valuation Inputs Dividend Growth Assumptions: Historical Growth Dividend Years & Sustainable Growth Do D-3 +($B$8/B7)^(1/3)-1 ROE Payout ratio D-10 b = plowback ratio (1-p C D & gbx ROE Dividend Yield Po Return Assumptions: CAPM DDM-Historical DDM-Sustainable g LTBY+R D. Po LTBY rm beta RP 7;=r; +('m) Do (1+g) Do (1+9) Po ri = " + g r=LT Po Part 1: Historical Sustainable Models CAPM DDM Avg Return LTBY + RP $ Stock Valuation - DDM - Multi-Stage Growth 1.25 Do 0.1 constant g 0.08 Growth Dividends Discount Factor PV CF 0.5 D. (1+9) Discount Factor = 1/(1+r) PV Cash Flow = Dividend x Disc Factor 0.5 0.5 HNM+in0002 ooooooo Price = $ . terminal value - Add in P10 $ 213.17 P10= D10 (1 + g) Por-g
Step by Step Solution
There are 3 Steps involved in it

Get step-by-step solutions from verified subject matter experts