

Question: Study the chart and the table below. Describe and summarize the information by selecting and reporting main features, and make comparisons where relevant. You should
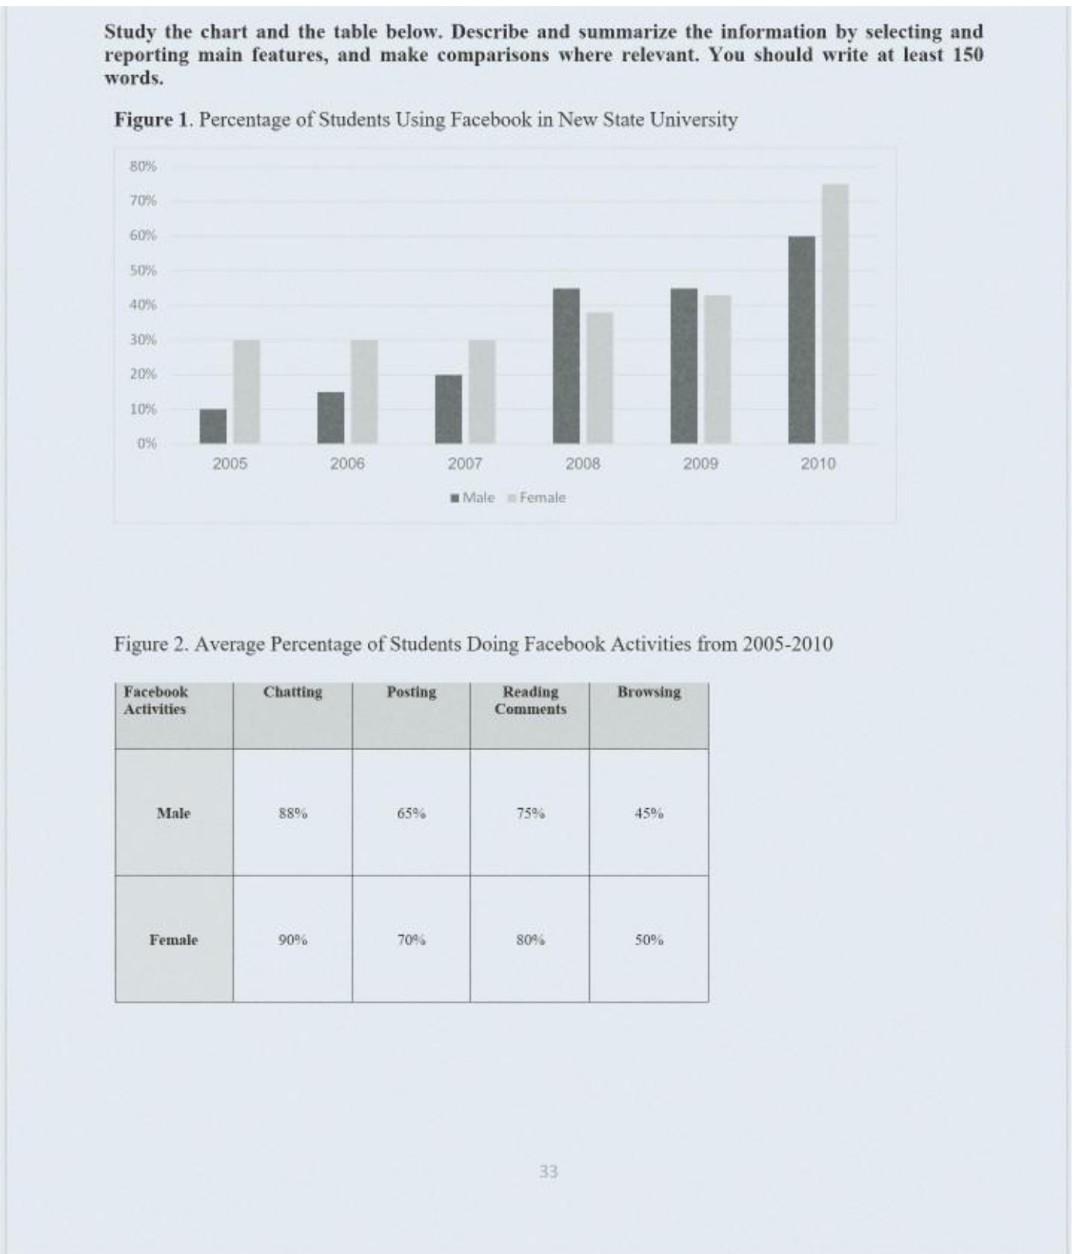
Study the chart and the table below. Describe and summarize the information by selecting and reporting main features, and make comparisons where relevant. You should write at least 150 words. Figure 1. Percentage of Students Using Facebook in New State University 80% 70% 60% 50% 40% 30% 20% 10% 0% 2005 2006 2007 2008 2009 2010 Male Female Figure 2. Average Percentage of Students Doing Facebook Activities from 2005-2010 Facebook Activities Chatting Posting Reading Comments Browsing Male 88% 65% 759 45% Female 90 7095 80% 50% 33
Step by Step Solution
There are 3 Steps involved in it
1 Expert Approved Answer
Step: 1 Unlock

Question Has Been Solved by an Expert!
Get step-by-step solutions from verified subject matter experts
Step: 2 Unlock
Step: 3 Unlock