

Question: Study the charts below. Describe and summarize the information by selecting and reporting main features, and make comparisons where relevant. You should write at least
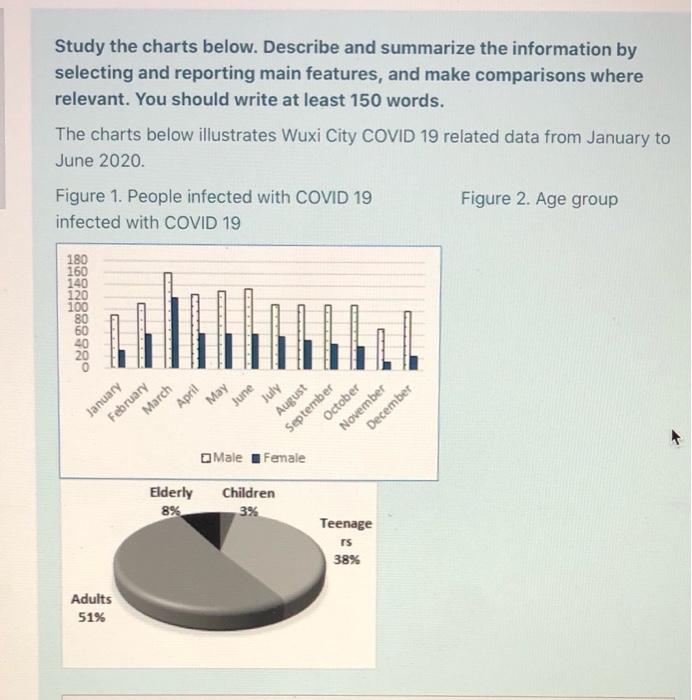
Study the charts below. Describe and summarize the information by selecting and reporting main features, and make comparisons where relevant. You should write at least 150 words. The charts below illustrates Wuxi City COVID 19 related data from January to June 2020. Figure 1. People infected with COVID 19 Figure 2. Age group infected with COVID 19 180 160 140 120 100 80 March April July May June August October November January February September December Male Female Elderly 8% Children 3% Teenage TS 38% Adults 51%
Step by Step Solution
There are 3 Steps involved in it
1 Expert Approved Answer
Step: 1 Unlock

Question Has Been Solved by an Expert!
Get step-by-step solutions from verified subject matter experts
Step: 2 Unlock
Step: 3 Unlock