

Question: Study the cross-over rate, NPV function and IRR criteria for mutually exclusive projects Datasheet - Demo Requirement 1 - Finish the NPV dynamics for mutually
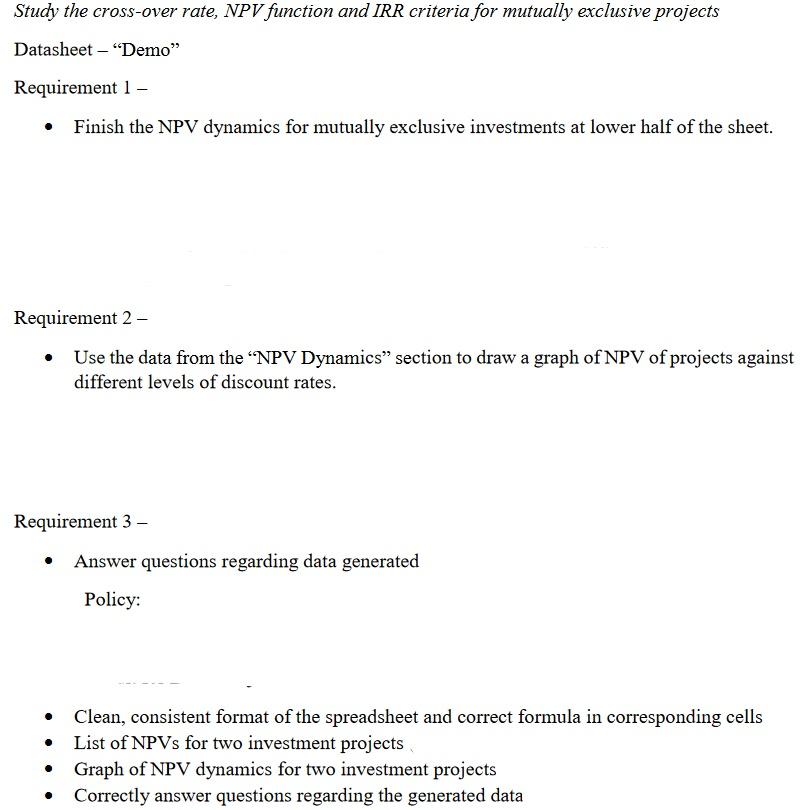
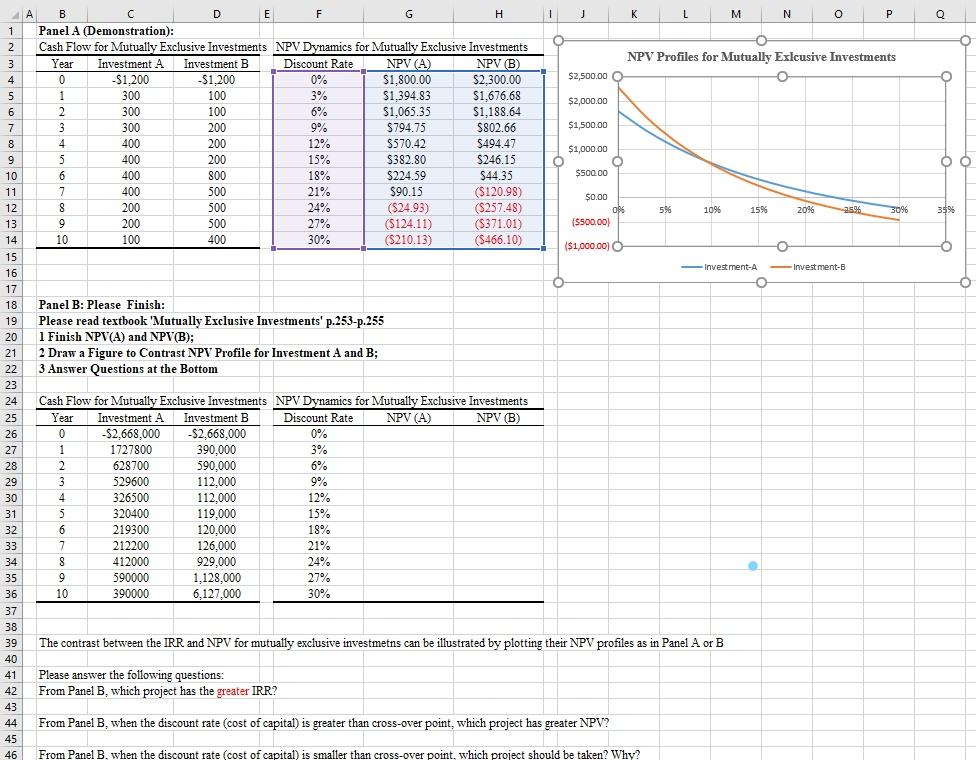
Study the cross-over rate, NPV function and IRR criteria for mutually exclusive projects Datasheet - "Demo" Requirement 1 - Finish the NPV dynamics for mutually exclusive investments at lower half of the sheet. Requirement 2 - Use the data from the "NPV Dynamics section to draw a graph of NPV of projects against different levels of discount rates. Requirement 3 - Answer questions regarding data generated Policy: . Clean, consistent format of the spreadsheet and correct formula in corresponding cells List of NPVs for two investment projects Graph of NPV dynamics for two investment projects Correctly answer questions regarding the generated data Q Od 35% B C D E F G H J K L M N 0 P 1 Panel A (Demonstration): 2 Cash Flow for Mutually Exclusive Investments NPV Dynamics for Mutually Exclusive Investments 3 Year Investment A Investment B Discount Rate NPV (A) NPV Profiles for Mutually Exlcusive Investments NPV (B) 4 0 o $1,200 -$1,200 0% $1,800.00 $2,500.00 O $2,300.00 5 1 300 100 3% $1,394.83 $1,676.68 $2,000.00 6 2 300 100 6% 070 $1,065.35 $1,188.64 7 3 300 200 9% 200 $794.75 $1,500.00 2 $802.66 3/94.13 8 4 400 200 12% 200 $570.42 $ 0.14 S494.47 g $1,000.00 9 5 400 104 200 200 15% % $382.80 S246.15 so... d 2012 10 6 400 800 % TU 18% * $500.00 SUU $224.59 % $44 35 . 3+1.32 11 7 400 500 21% $90.15 ($120.98) $0.00 12 8 200 500 24% ($24.93) ($257.48) 06 596 10% 15% 2096 25% 3096 13 9 200 500 27% (5124.11) (5371.01) {$500.00) 14 10 100 400 30% ($210.13) (5466.10) ($1.000.00) 15 15 16 Investment-A Investment- 16 17 0 18 18 Panel B: Please Finish: 19 Please read textbook 'Mutually Exclusive Investments' p.253-p.255 20 1 Finish NPV(A) and NPV(B); 21 2 Draw a Figure to Contrast NPV Profile for Investment A and B; 22 3 Answer Questions at the Bottom 23 24 Cash Flow for Mutually Exclusive Investments NPV Dynamics for Mutually Exclusive Investments - 25 Investment A Investment B Discount Rate NPV (A) NPV (B) a 26 0 -S2,668,000 -$2,668,000 0% 27 1 1 1727800 390,000 3% % 28 2 628700 590,000 6% 29 3 529600 112,000 9% wa 119. 30 4 326500 2016 112,000 12% 31 5 320400 119,000 15% os 32 6 219300 120,000 18% 33 7 212200 126,000 21% 34 8 412000 929,000 24% 35 9 590000 1,128,000 27% 36 10 390000 6,127,000 30% 37 37 30 38 39 The contrast between the IRR and NPV for mutually exclusive investmetns can be illustrated by plotting their NPV profiles as in Panel A or B 40 41 Please answer the following questions: 42 From Panel B, which project has the greater IRR? 43 44 From Panel B, when the discount rate (cost of capital) is greater than cross-over point, which project has greater NPV? 45 46 From Panel B. when the discount rate (cost of capital) is smaller than cross-over point, which project should be taken? Why? Year
Step by Step Solution
There are 3 Steps involved in it

Get step-by-step solutions from verified subject matter experts