

Question: Study the information provided below and answer the questions that follow. 5.1 The data in the table below represents the actual quarterly sales and
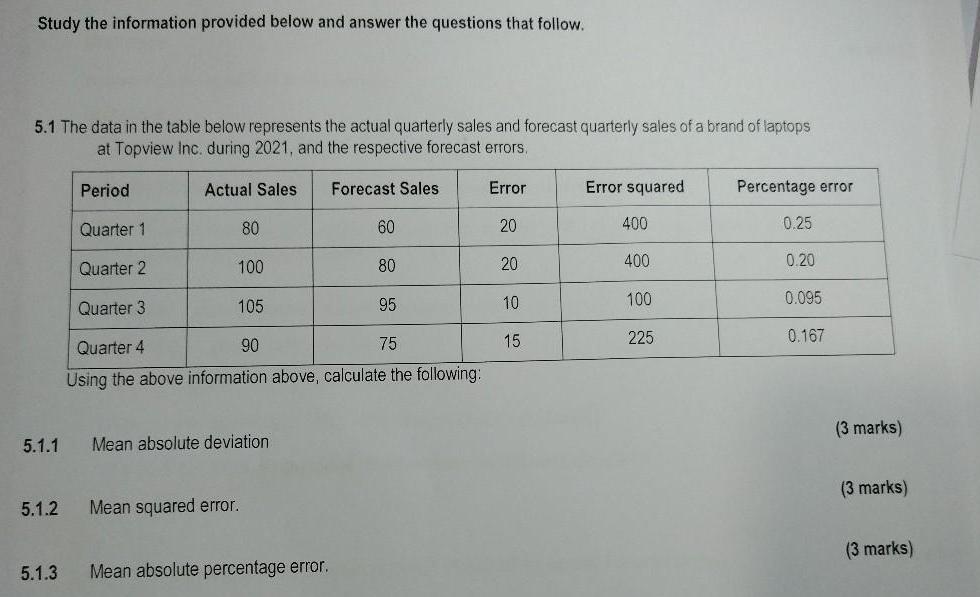
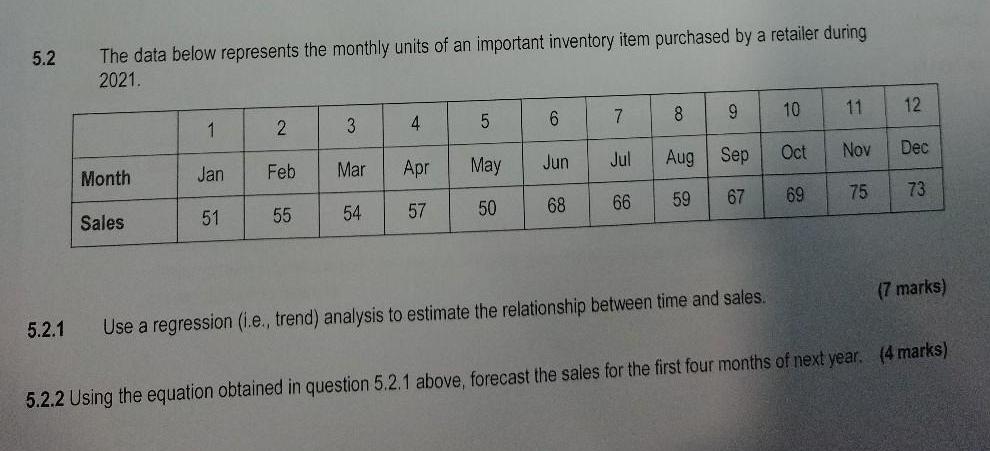
Study the information provided below and answer the questions that follow. 5.1 The data in the table below represents the actual quarterly sales and forecast quarterly sales of a brand of laptops at Topview Inc. during 2021, and the respective forecast errors. Actual Sales 5.1.1 5.1.2 5.1.3 Period Quarter 1 Quarter 2 100 Quarter 3 105 95 Quarter 4 90 75 Using the above information above, calculate the following: 80 Mean absolute deviation Mean squared error. Forecast Sales Mean absolute percentage error. 60 80 Error 20 20 10 15 Error squared 400 400 100 225 Percentage error 0.25 0.20 0.095 0.167 (3 marks) (3 marks) (3 marks) 5.2 5.2.1 The data below represents the monthly units of 2021. Month Sales 1 Jan 51 2 Feb 55 3 Mar 54 important inventory item purchased by a retailer during 4 Apr May 57 50 6 Jun 68 7 Jul 66 8 Aug 59 9 Sep 67 Use a regression (i.e., trend) analysis to estimate the relationship between time and sales. 10 Oct 69 12 Nov Dec 75 73 11 (7 marks) 5.2.2 Using the equation obtained in question 5.2.1 above, forecast the sales for the first four months of next year. (4 marks)
Step by Step Solution
3.41 Rating (164 Votes )
There are 3 Steps involved in it
Solution 511 Mean Absolute Deviation MAD To calculate the Mean Absolute Deviation we need to sum up the absolute values of the forecast errors and div... View full answer

Get step-by-step solutions from verified subject matter experts