

Question: Study the scenario and complete the question ( s ) that follow ( s ) : Screen Time and Productivity Study A health and productivity
Study the scenario and complete the questions that follows:
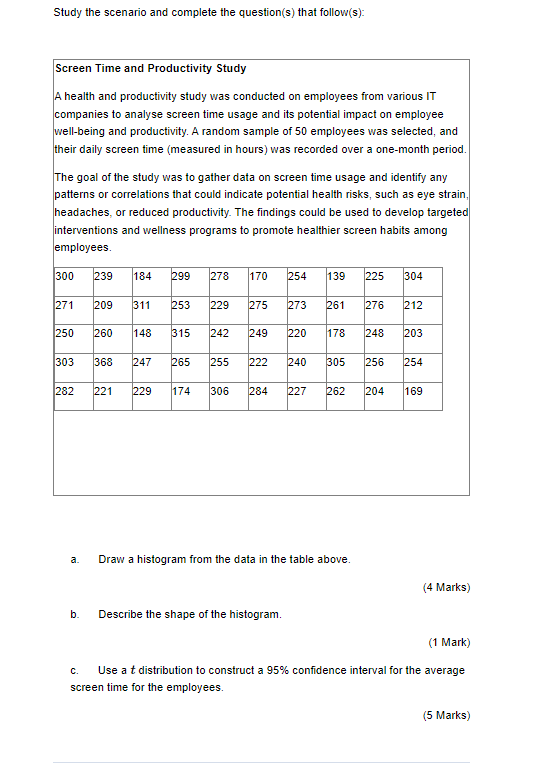
Screen Time and Productivity Study
A health and productivity study was conducted on employees from various IT
companies to analyse screen time usage and its potential impact on employee
wellbeing and productivity. A random sample of employees was selected, and
their daily screen time measured in hours was recorded over a onemonth period.
The goal of the study was to gather data on screen time usage and identify any
patterns or correlations that could indicate potential health risks, such as eye strain,
headaches, or reduced productivity. The findings could be used to develop targeted
interventions and wellness programs to promote healthier screen habits among
employees.
a Draw a histogram from the data in the table above.
Marks
b Describe the shape of the histogram.
Mark
c Use a distribution to construct a confidence interval for the average
screen time for the employees.
Step by Step Solution
There are 3 Steps involved in it
1 Expert Approved Answer
Step: 1 Unlock

Question Has Been Solved by an Expert!
Get step-by-step solutions from verified subject matter experts
Step: 2 Unlock
Step: 3 Unlock