

Question: Study this graph, then complete each gap in the summary below with an expression selected from the dropdown list. There are two expressions more
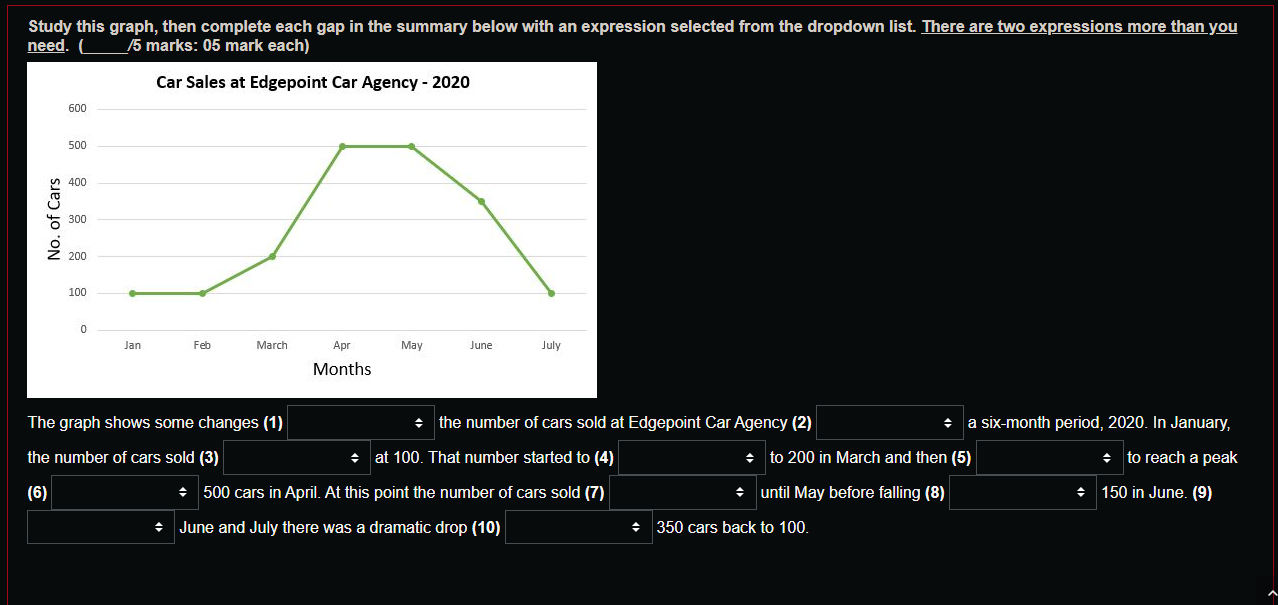
Study this graph, then complete each gap in the summary below with an expression selected from the dropdown list. There are two expressions more than you need. ( /5 marks: 05 mark each) Car Sales at Edgepoint Car Agency - 2020 600 500 * 400 * 300 200 100 Jan Feb March Apr May June July Months The graph shows some changes (1) the number of cars sold at Edgepoint Car Agency (2) + a six-month period, 2020. In January, the number of cars sold (3) + at 100. That number started to (4) to 200 in March and then (5) + to reach a peak (6) + 500 cars in April. At this point the number of cars sold (7) until May before falling (8) + 150 in June. (9) June and July there was a dramatic drop (10) + 350 cars back to 100. No. of Cars
Step by Step Solution
3.44 Rating (167 Votes )
There are 3 Steps involved in it
1 For the first blank in would be suitable as there were seen changes in the num... View full answer

Get step-by-step solutions from verified subject matter experts