

Question: Subject: Data Analytics Question: Please discuss the results obtained + Code + Text Copy to Drive RAM L Disk Editing A [] from google.colab import
![Text Copy to Drive RAM L Disk Editing A [] from google.colab](https://dsd5zvtm8ll6.cloudfront.net/si.experts.images/questions/2024/09/66f458ed270d0_58066f458eca6692.jpg)
![remount, call drive.mount("/content/drive", force_remount=True). #@title import pandas df = pandas.read_csv('/content/costumer.csv') [] from](https://dsd5zvtm8ll6.cloudfront.net/si.experts.images/questions/2024/09/66f458ee694f3_58266f458ee0d4e3.jpg)
 Subject: Data Analytics
Question: Please discuss the results obtained
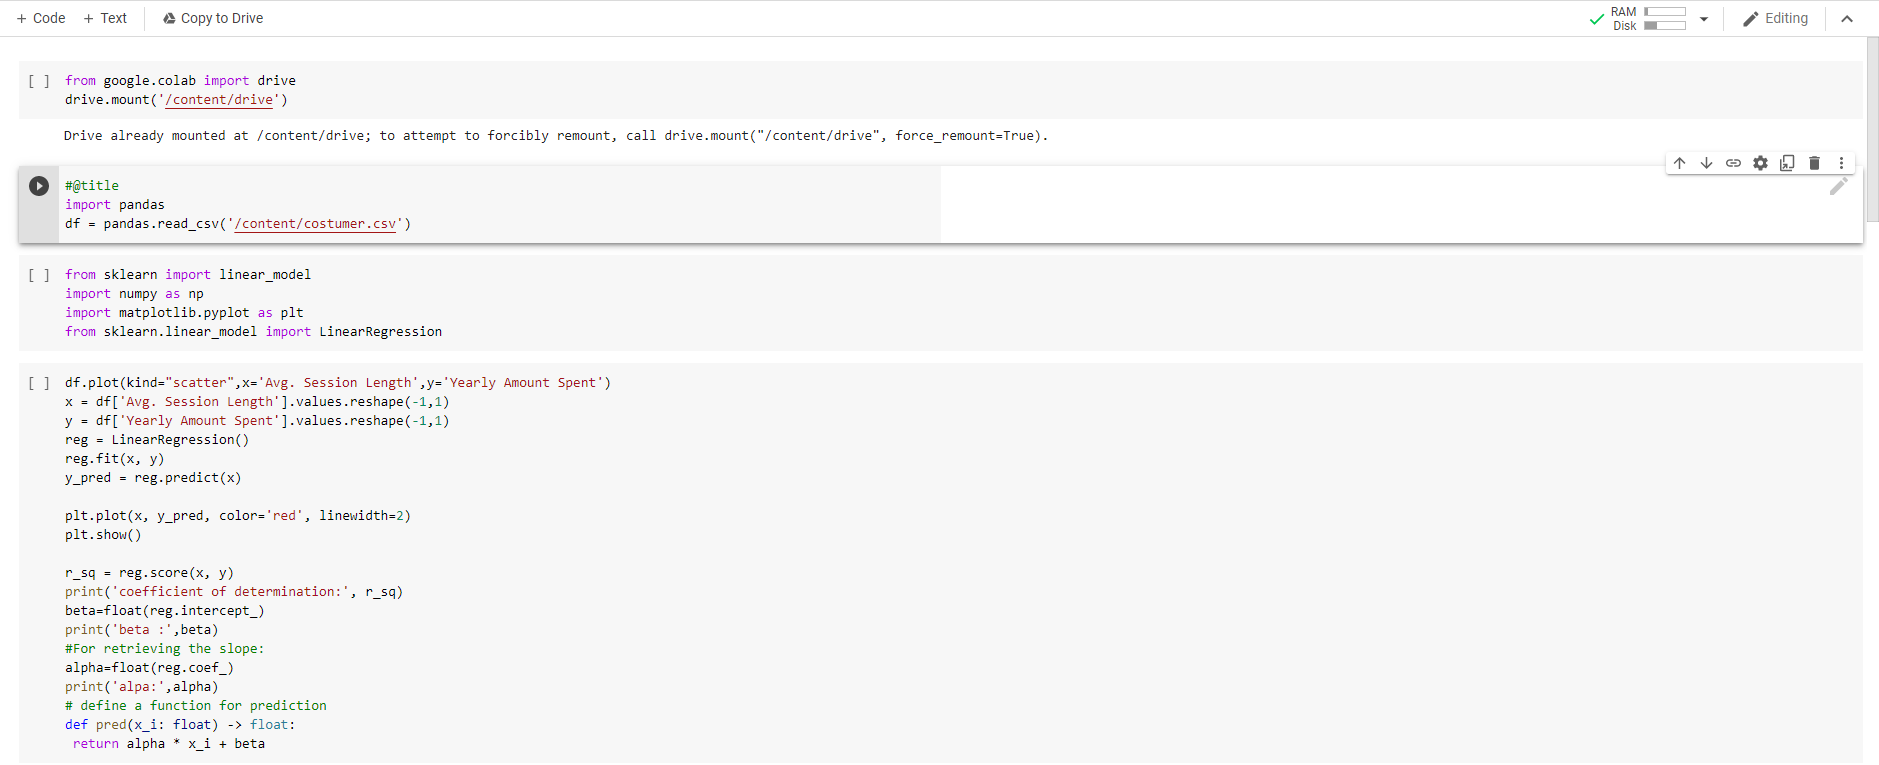
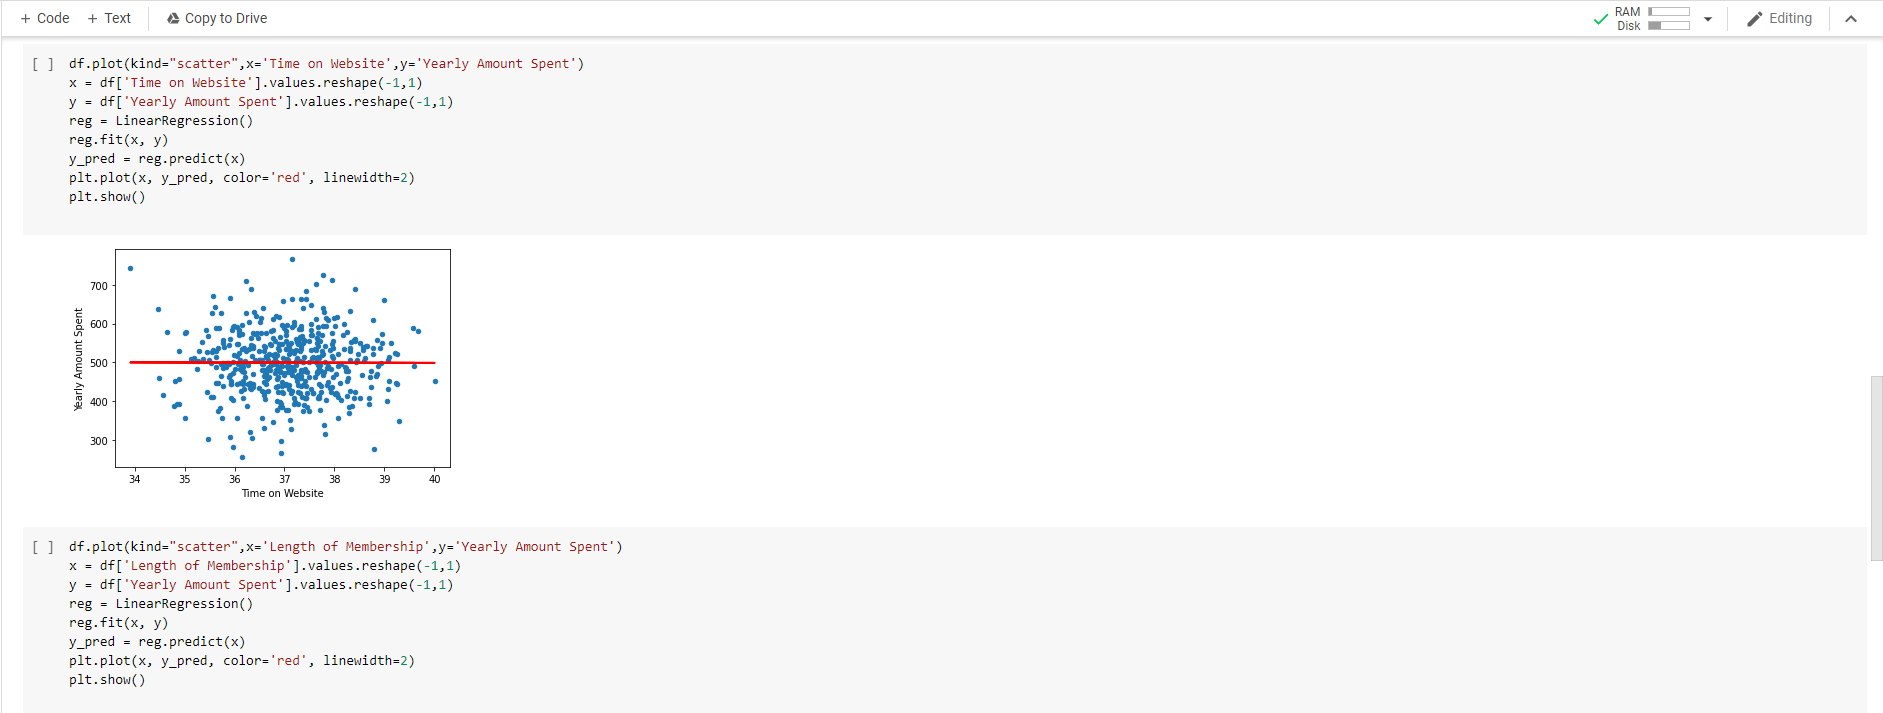
+ Code + Text Copy to Drive RAM L Disk Editing A [] from google.colab import drive drive.mount('/content/drive') Drive already mounted at /content/drive; to attempt to forcibly remount, call drive.mount("/content/drive", force_remount=True). #@title import pandas df = pandas.read_csv('/content/costumer.csv') [] from sklearn import linear_model import numpy as np import matplotlib.pyplot as plt from sklearn.linear_model import Linear regression [ ] df.plot(kind="scatter",x='Avg. Session Length', y='Yearly Amount Spent') x = df['Avg. Session Length'].values.reshape(-1,1) y = df [ 'Yearly Amount Spent').values.reshape (-1,1) reg - Linear regression() reg.fit(x, y) y_pred = reg. predict(x) plt.plot(x, y_pred, color='red', linewidth=2) plt.show() r_59 = reg.score(x, y) print('coefficient of determination:', r_sq) beta=float(reg.intercept_) print('beta :', beta) #For retrieving the slope: alpha=float(reg.coef_) print('alpa:', alpha) # define a function for prediction def pred(x_i: float) -> float: return alpha * x_i + beta + Code + Text A Copy to Drive RAM C Disk Editing [] 700 600 Yearly Amount Spent 500 400 300 30 31 32 34 35 36 Avg. Session Length coefficient of determination: 0.12608769710022838 beta: -438.56274367909253 alpa: 28.374770547430963 [ ] df.plot(kind="scatter",x='Time on App', y='Yearly Amount Spent') x = df [ 'Time on App').values.reshape (-1,1) y = df [ 'Yearly Amount Spent').values.reshape(-1,1) reg = Linear regression() reg.fit(x, y) y_pred = reg.predict(x) plt.plot(x, y_pred, color='red', linewidth=2) plt.show() 700 600 Yearly Amount Spent 500 400 300 9 10 11 12 Time on App 13 14 15 + Code + Text Copy to Drive RAM Disk Editing [] df.plot(kind="scatter",x='Time on Website', y='Yearly Amount Spent') x = df['Time on Website'].values.reshape(-1,1) y = df['Yearly Amount Spent').values.reshape(-1,1) reg - LinearRegression() reg. fit(x, y) y_pred - reg.predict(x) plt.plot(x, y_pred, color='red', linewidth=2) plt.show() 700 600 Yearly Amount Spent 500 400 300 34 40 37 Time on Website [] df.plot(kind="scatter",x='Length of Membership', y='Yearly Amount Spent') x = df ['Length of Membership'].values.reshape(-1,1) y = df['Yearly Amount Spent').values.reshape (-1,1) reg = LinearRegression() reg.fit(x, y) y_pred = reg.predict(x) plt.plot(x, y_pred, color='red', linewidth=2) plt.show() 700 600 Yearly Amount Spent 500 400 300 0 6 7 Length of Membership []df.plot(kind="scatter",x='Length of Membership', 'Time on Website', y='Yearly Amount Spent') x = df[['Length of Membership', 'Time on Website']].values.reshape(-1,1) y = df [ 'Yearly Amount Spent').values.reshape (-1,1) reg = Linear regression() reg. fit(x, y) y_pred = reg.predict(x) plt.plot(x, y_pred, color='red', linewidth=2) plt.show File "
Step by Step Solution
There are 3 Steps involved in it

Get step-by-step solutions from verified subject matter experts