

Question: subject : Industrial Engineering use L3D = 231 (b) A hospital emergency department is monitoring the time required to admit a patient using XBar and
subject : Industrial Engineering 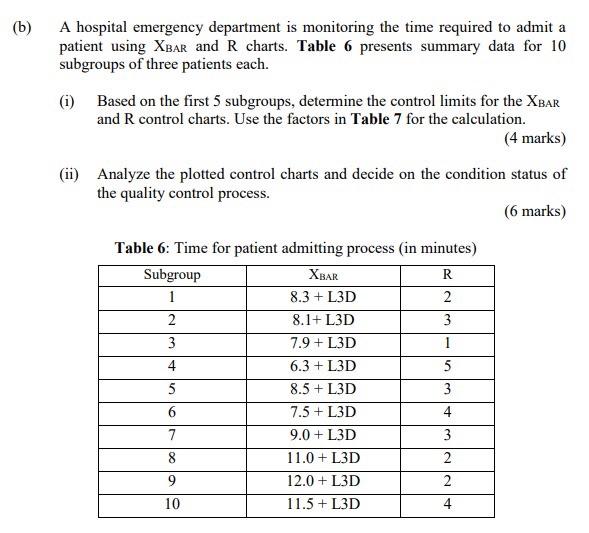
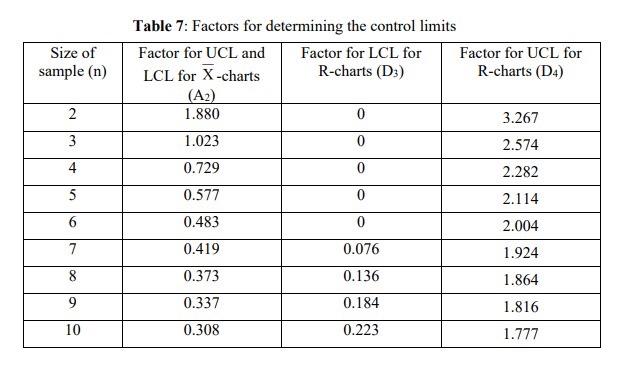
(b) A hospital emergency department is monitoring the time required to admit a patient using XBar and R charts. Table 6 presents summary data for 10 subgroups of three patients each. (1) Based on the first 5 subgroups, determine the control limits for the XBAR and R control charts. Use the factors in Table 7 for the calculation. (4 marks) (ii) Analyze the plotted control charts and decide on the condition status of the quality control process. (6 marks) Table 6: Time for patient admitting process in minutes) Subgroup XBAR R 1 8.3 + L3D 2 2 8.1+ L3D 3 3 7.9 + L3D 1 4 6.3 + L3D 5 5 8.5 + L3D 3 6 7.5 + L3D 4 7 9.0 + L3D 3 8 11.0 + L3D 2 9 12.0 + L3D 2 10 11.5 + L3D 4 NI Size of sample (n) 2 3 4 Table 7: Factors for determining the control limits Factor for UCL and Factor for LCL for Factor for UCL for LCL for X-charts R-charts (D3) R-charts (D4) (A2) 1.880 0 3.267 1.023 0 2.574 0.729 0 2.282 0.577 0 2.114 0.483 0 2.004 0.419 0.076 1.924 0.373 0.136 1.864 0.337 0.184 1.816 0.308 0.223 1.777 5 6 7 8 9 10 use L3D = 231
Step by Step Solution
There are 3 Steps involved in it
1 Expert Approved Answer
Step: 1 Unlock

Question Has Been Solved by an Expert!
Get step-by-step solutions from verified subject matter experts
Step: 2 Unlock
Step: 3 Unlock