

Question: subject math lab....need 100% right answer... its urgent Program to plot the following graphics. The requirements are as follows: 1) Divide the plotting window into
subject math lab....need 100% right answer... its urgent
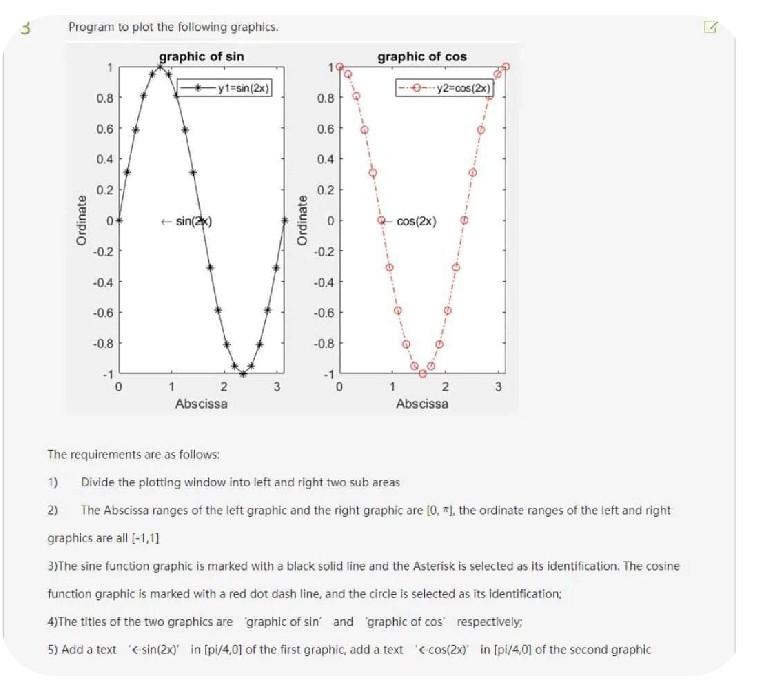
Program to plot the following graphics. The requirements are as follows: 1) Divide the plotting window into left and right two sub areas 2) The Abscissa ranges of the left graphic and the right graphic are [0,], the ordinate ranges of the left and right graphics are all [1,1] 3)The sine function graphic is marked with a black solid line and the Asterisk is selected as its identification. The cosine function graphic is marked with a red dot dash line, and the circle is selected as its identification: 4)The titles of the two graphics are 'graphic of sin and 'graphic of cos' respectlvely; 5) Add a text ' csin(2x) ' in [pi/4,0] of the first graphic, add a text ' ccos(2x) ' in [pi/4,0] of the second graphic
Step by Step Solution
There are 3 Steps involved in it

Get step-by-step solutions from verified subject matter experts