

Question: subject is matlab urgent answer pleaseeee Program to plot the following graphics. The requirements are as follows: 1) Divide the plotting window into upper and
subject is matlab
urgent answer pleaseeee
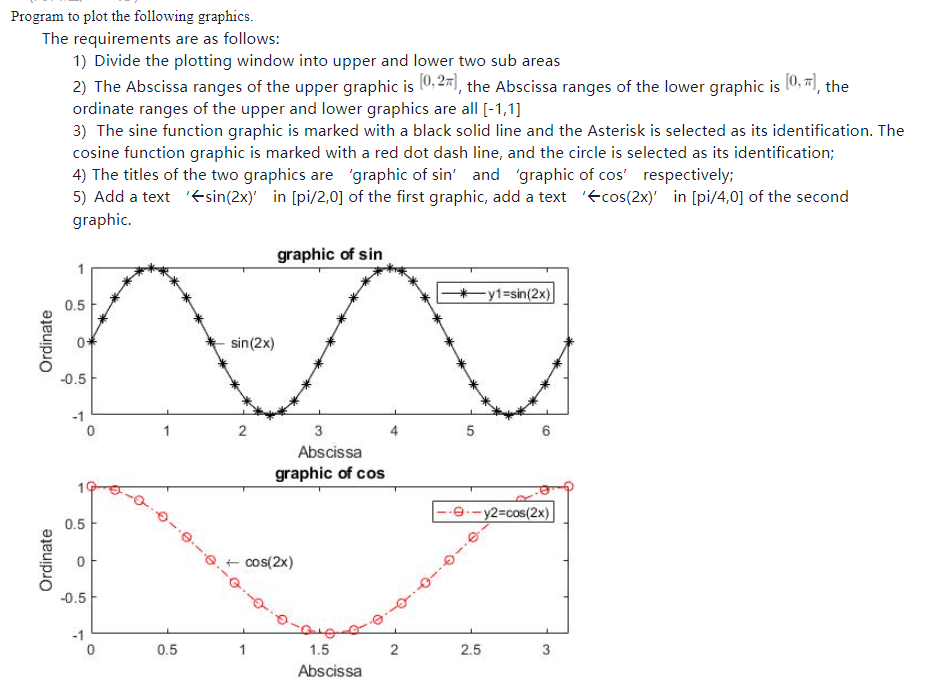
Program to plot the following graphics. The requirements are as follows: 1) Divide the plotting window into upper and lower two sub areas 2) The Abscissa ranges of the upper graphic is (0,27), the Abscissa ranges of the lower graphic is (0,61), the ordinate ranges of the upper and lower graphics are all (-1,1] 3) The sine function graphic is marked with a black solid line and the Asterisk is selected as its identification. The cosine function graphic is marked with a red dot dash line, and the circle is selected as its identification; 4) The titles of the two graphics are 'graphic of sin' and 'graphic of cos' respectively; 5) Add a text 'fsin(2x)' in [pi/2,0] of the first graphic, add a text 'fcos(2x)' in [pi/4,0] of the second graphic. graphic of sin -y1=sin(2x) 0.5 Ordinate 0 sin (2x) -0.5 -1 0 2 N 5 6 3 Abscissa graphic of cos e -y2=cos(2x) 0.5 Ordinate 0 cos(2x) -0.5 -1 0.5 1 N 2 2.5 3 1.5 Abscissa
Step by Step Solution
There are 3 Steps involved in it

Get step-by-step solutions from verified subject matter experts