

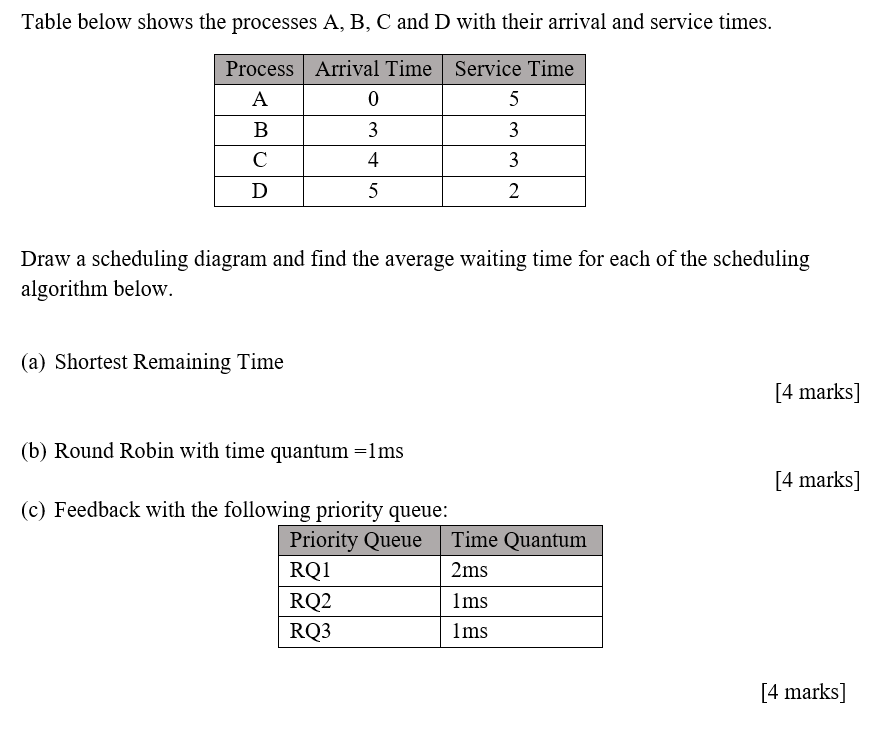
Question: Subject: Operating Systems Table below shows the processes A, B, C and D with their arrival and service times. Process Arrival Time Service Time A
 Subject: Operating Systems
Table below shows the processes A, B, C and D with their arrival and service times. Process Arrival Time Service Time A 0 5 B 3 3 4 3 D 5 2 2 Draw a scheduling diagram and find the average waiting time for each of the scheduling algorithm below. (a) Shortest Remaining Time [4 marks] (b) Round Robin with time quantum =lms [4 marks] (c) Feedback with the following priority queue: Priority Queue Time Quantum RQ1 2ms RQ2 1ms RQ3 1ms [4 marks]
Step by Step Solution
There are 3 Steps involved in it
1 Expert Approved Answer
Step: 1 Unlock

Question Has Been Solved by an Expert!
Get step-by-step solutions from verified subject matter experts
Step: 2 Unlock
Step: 3 Unlock