

The wavelengths of maximum absorption and emission of anthracene in Figure 17-22 are approximately 357 and 402
Question:
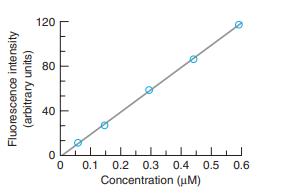
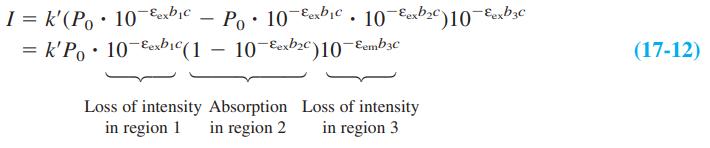
The wavelengths of maximum absorption and emission of anthracene in Figure 17-22 are approximately 357 and 402 nm. Molar absorptivities at these wavelengths are εex 9.0 × 10³M-1 cm-1 and εem = 5 × 101 M-1 cm-1. Consider a fluorescence experiment in Figure 17-21 with cell dimensions b1 = 0.30 cm, b2 = 0.40 cm, and b3 = 0.5 cm. Calculate the relative fluorescence intensity with Equation 17-12 as a function of concentration over the range 10-8 to 10-3 M. Explain the shape of the curve. Up to approximately what concentration is fluorescence proportional to concentration (within 5%)? Is the calibration range in Figure 17-23 sensible?
Figure 17-21
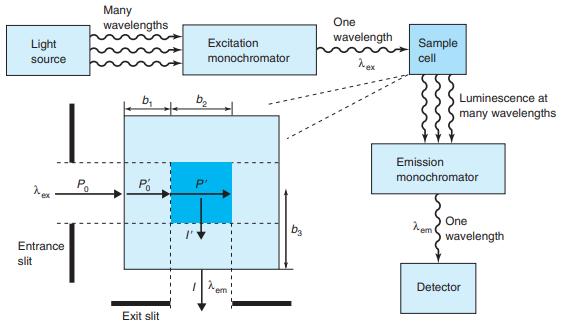
Figure 17-22
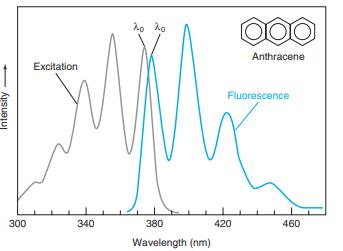
Figure 17-23
Equation 17-12
Fantastic news! We've Found the answer you've been seeking!
Step by Step Answer:
The spreadsheet computes relative fluorescence given by Relative intensity 1KP0 10 exb1c l 10 exb1c ...View the full answer

Answered By
Naveen Krishna
from last 2 years, I'm working for Chegg as QA expert and as well as TBS expert.
0 Reviews
10+ Question Solved
Related Book For 

Question Posted:
