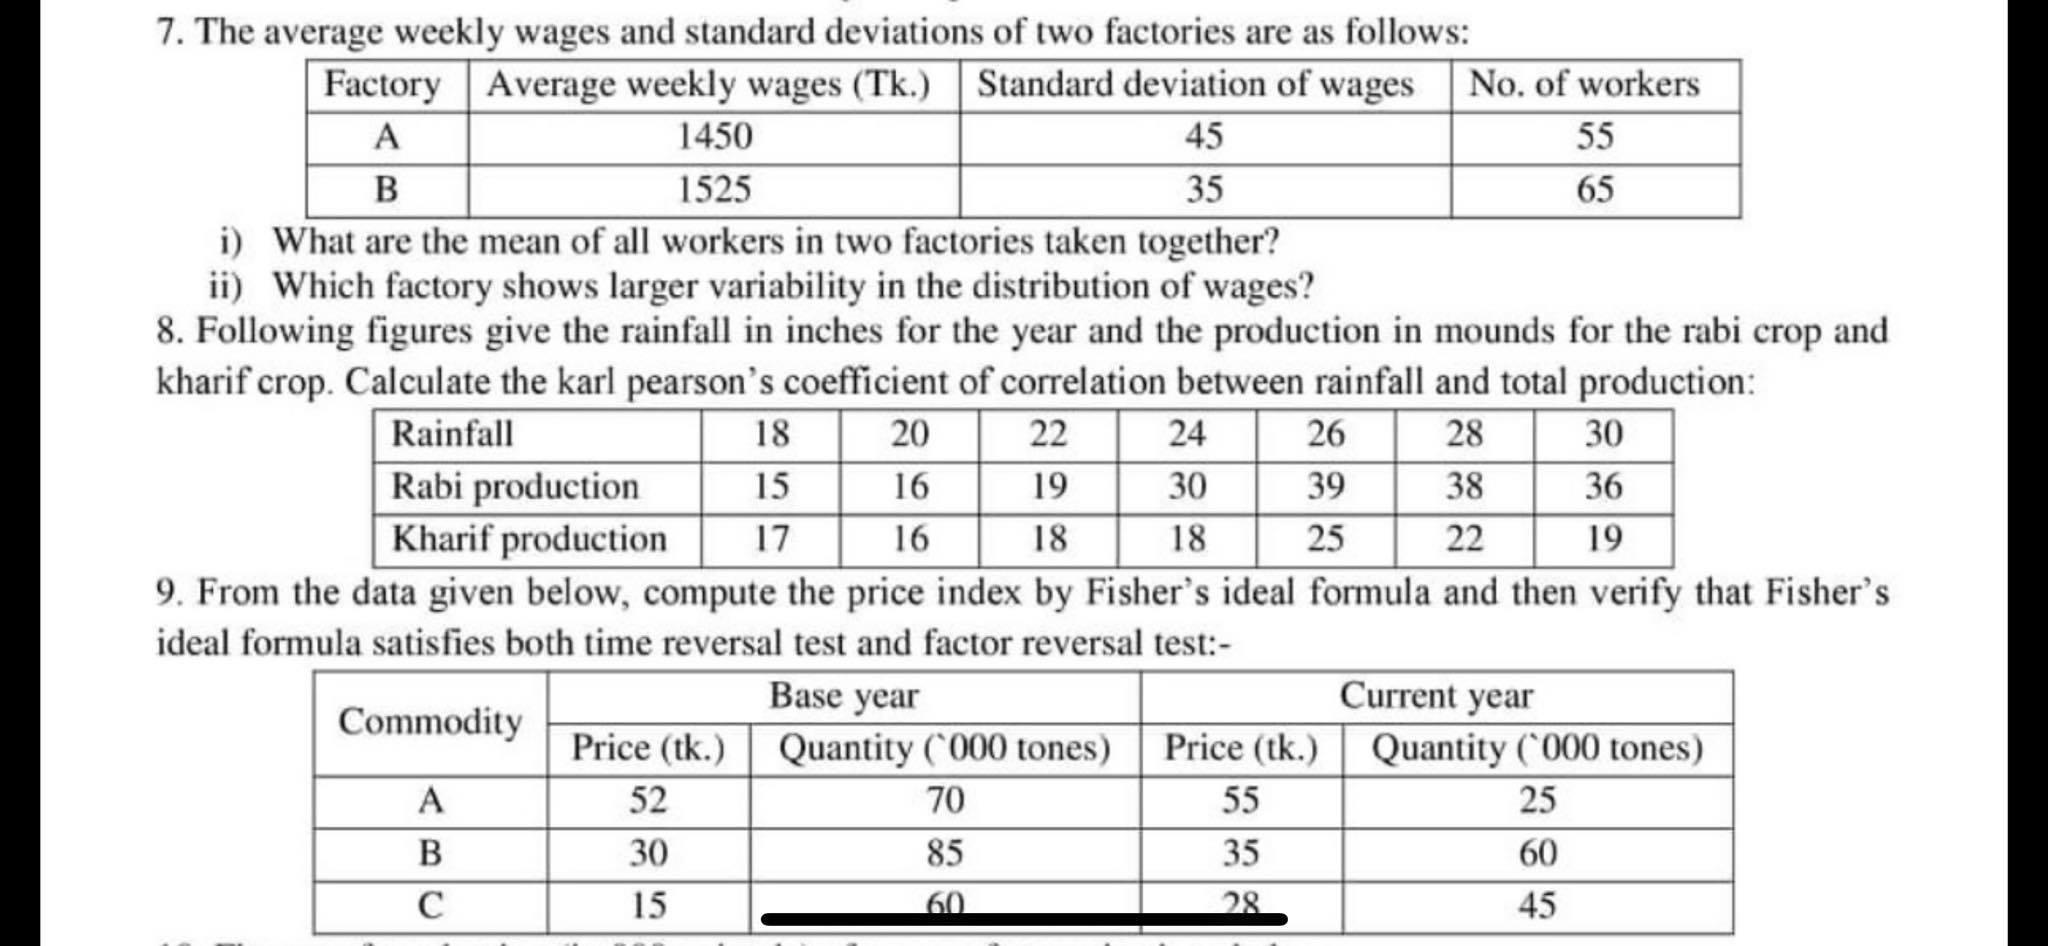
Question: Subject: Statistics (please answer qs no 7) 18 20 7. The average weekly wages and standard deviations of two factories are as follows: Factory Average

Subject: Statistics (please answer qs no 7) 18 20 Subject: Statistics (please answer qs no 7)

18 20 7. The average weekly wages and standard deviations of two factories are as follows: Factory Average weekly wages (Tk.) Standard deviation of wages No. of workers A 1450 45 55 B 1525 35 65 i) What are the mean of all workers in two factories taken together? ii) Which factory shows larger variability in the distribution of wages? 8. Following figures give the rainfall in inches for the year and the production in mounds for the rabi crop and kharif crop. Calculate the karl pearson's coefficient of correlation between rainfall and total production: Rainfall 22 24 26 28 30 Rabi production 15 16 19 30 39 38 36 Kharif production 17 16 18 18 25 22 19 9. From the data given below, compute the price index by Fisher's ideal formula and then verify that Fisher's ideal formula satisfies both time reversal test and factor reversal test:- Base year Current year Commodity Price (tk.) Quantity ('000 tones) Price (tk.) Quantity ('000 tones) A 52 70 55 25 B 30 35 60 15 60 28 45 85

Step by Step Solution

There are 3 Steps involved in it

1 Expert Approved Answer
Step: 1 Unlock blur-text-image
Question Has Been Solved by an Expert!

Get step-by-step solutions from verified subject matter experts

Step: 2 Unlock
Step: 3 Unlock

Students Have Also Explored These Related General Management Questions!