

Question: Submit tes point(s) possible Draw the normal curve with the parameters indicated. Then find the probability of the random variable X. Shade the area that
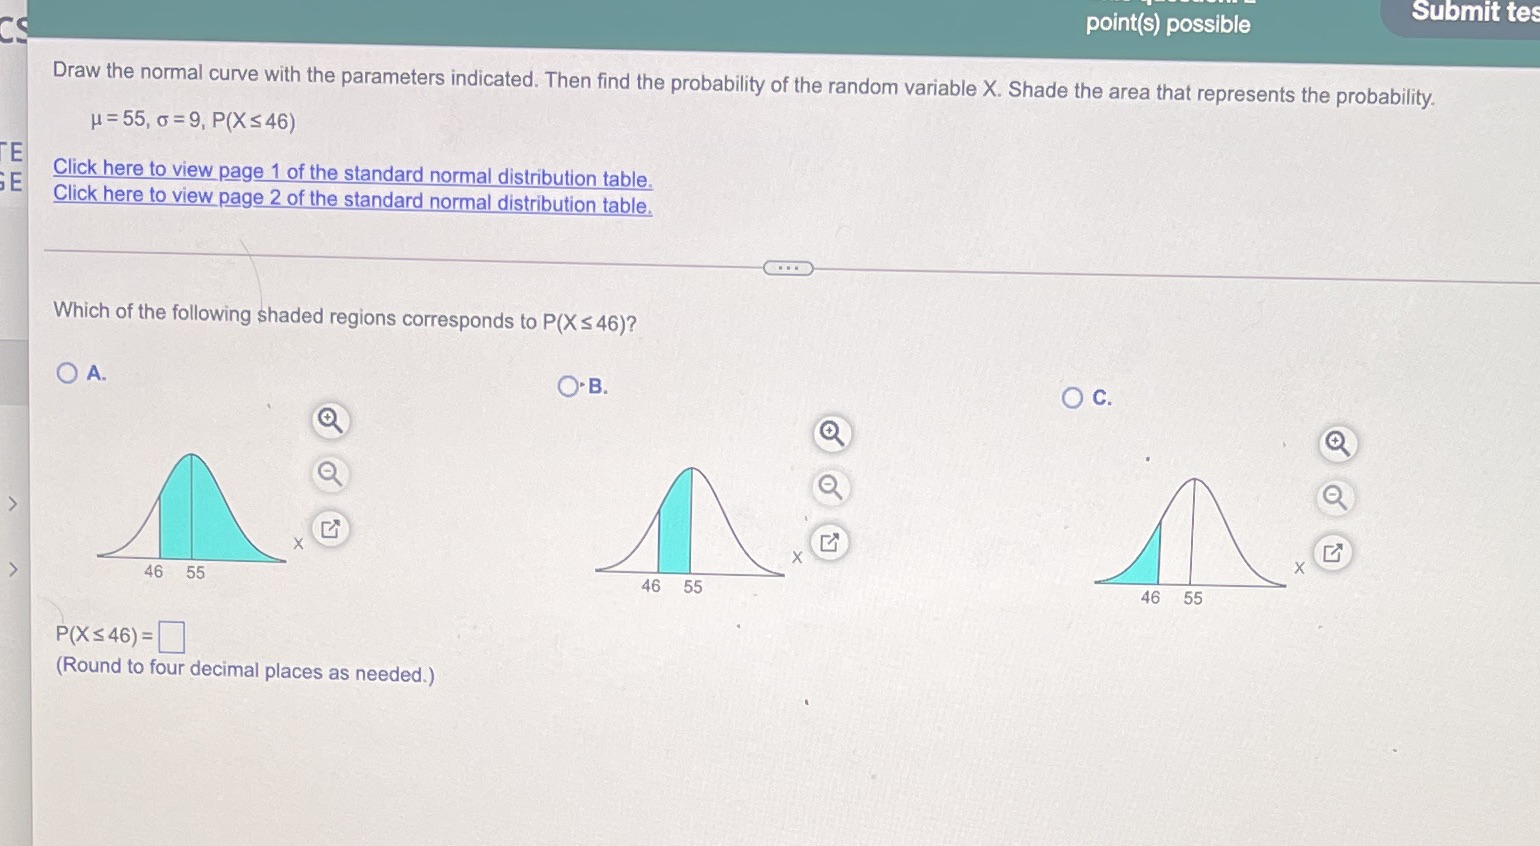

Submit tes point(s) possible Draw the normal curve with the parameters indicated. Then find the probability of the random variable X. Shade the area that represents the probability. H = 55, 6 =9, P(X $ 46) E E Click here to view page 1 of the standard normal distribution table. Click here to view page 2 of the standard normal distribution table. Which of the following shaded regions corresponds to P(X s 46)? O A. O. B. O C. X X X 46 55 46 55 46 55 P(X S 46) = (Round to four decimal places as needed.)
Step by Step Solution
There are 3 Steps involved in it
1 Expert Approved Answer
Step: 1 Unlock

Question Has Been Solved by an Expert!
Get step-by-step solutions from verified subject matter experts
Step: 2 Unlock
Step: 3 Unlock