

Question: summarize the article below by reading it on google Using Customer Analytics to Improve Customer Retention By William M. Saubert i just uploaded the article
summarize the article below by reading it on google
i just uploaded the article and it should be 125 words. thank you.
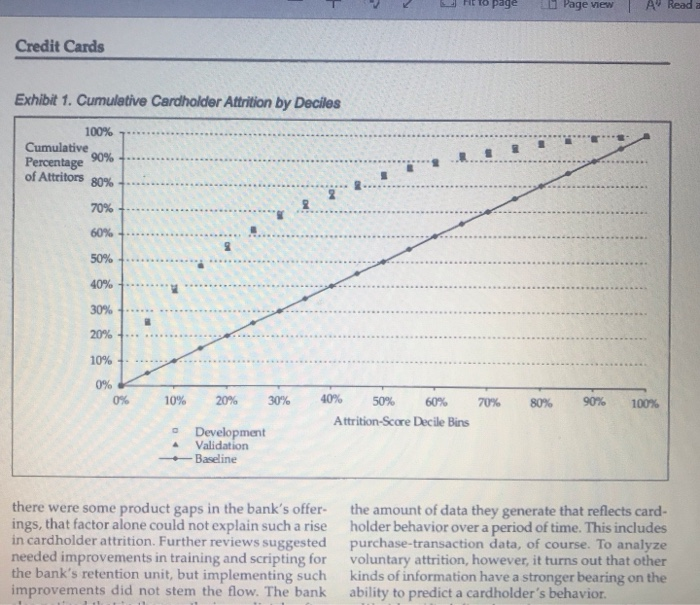
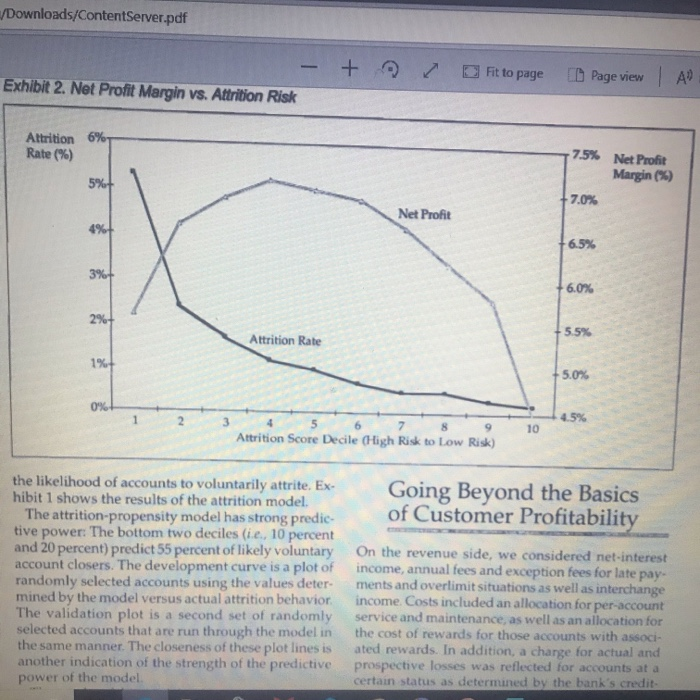
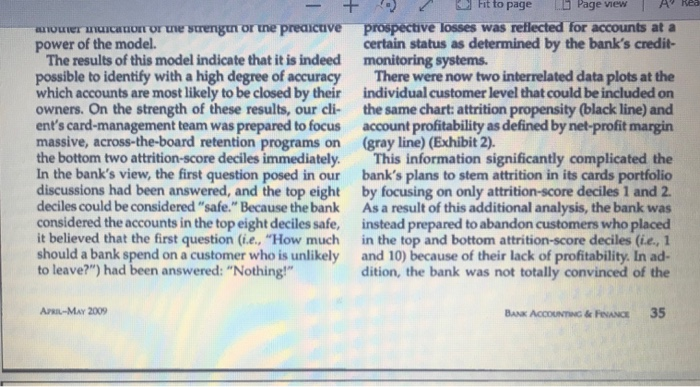
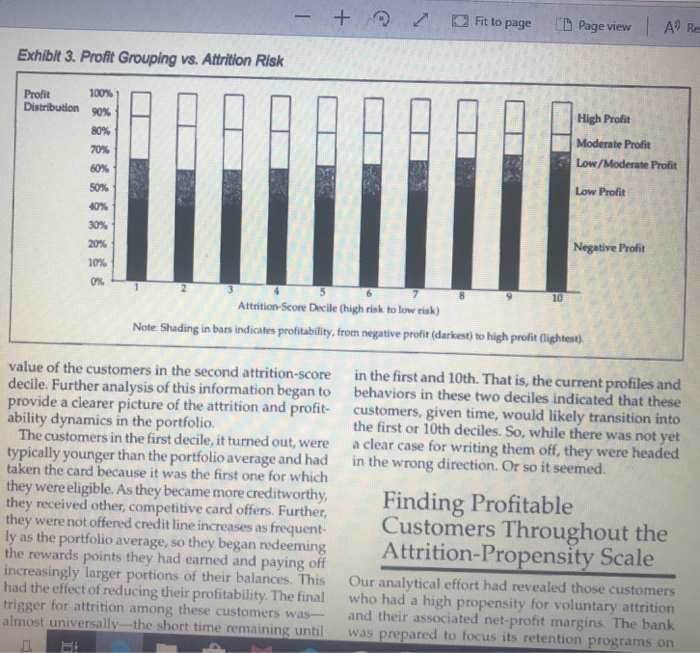
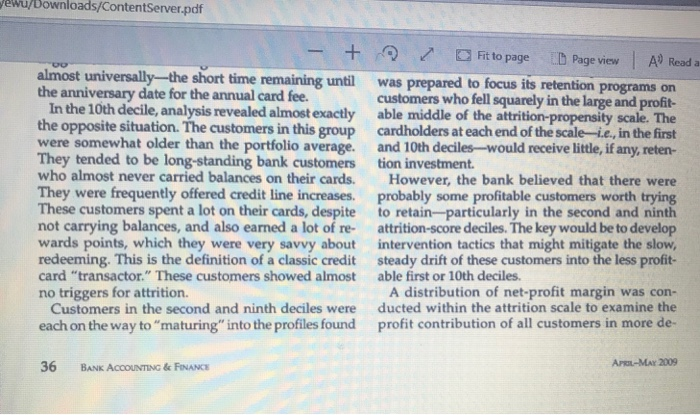
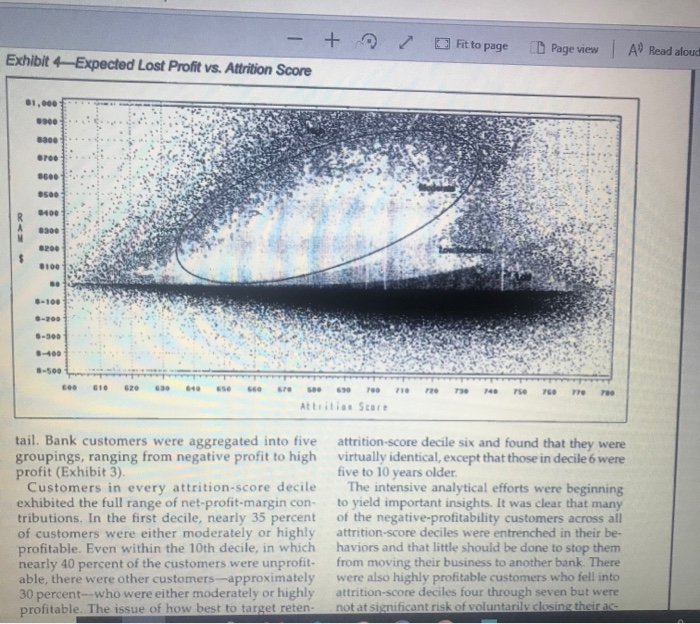
2 page Page view A Read alou Using Customer Analytics to Improve Customer Retention By William M. Saubert How much should a bank invest in a customer who is unlikely to leave? The conventional wisdom throughout retail- industry circles is that it costs significantly more to acquire new customers than to retain old ones. In fact, among financial-services compa nies, there is reliable evidence that it costs five times more to acquire a new customer than to retain an existing one. Perhaps this emphasis on the value of existing customers has been partially a response to (or even justification for) the intensive focus financial institutions have placed on customer relationship management (CRM) strategies and related tech- nologies over the past dozen or so years. During that period, CRM investments have not been small; indeed, they have reportedly amounted to tens of millions of dollars annually. Missing from most discussions surrounding possible investments in technology or marketing intended to keep existing customers are the answers to a number of vital questions: sights into cardholders potential present and future profitability to the bank. Using these insights, the bank tailored its retention programs to drive down its attri- tion rate by double digits-to below market average. The method we developed holds important and valu- able lessons for financial institutions globally, Deregulation Leads to Deteriorating Portfolio Performance Until the early to mid-1980s, banking in Australia was characterized by state-owned institutions that had little incentive to compete either on product dif- ferentiation or customer service. The rates and terms on most deposit and borrowing products available in major cities were remarkably similar. The Big Four banks (Australia New Zealand Bank, Commonwealth Bank, National Australia Bank and Westpac) were - + intended to keep existing customers are the answers to a number of vital questions: How much should a bank invest in a customer who is unlikely to leave? How much should a bank invest in a customer who is currently unprofitable? How much should a bank invest in a customer who is currently unprofitable but who could become highly profitable in the future? By combining data analytics and knowledge of payments, a team from MasterCard Advisors devised solutions that helped a large Australian bank answer these questions. On behalf of the bank, our team cre- ated a number of behavioral models that identified which customers were most likely to be at risk of attrition; these models also provided actionable in Fit to page Page view A Read aloud banks (Australia New Zealand Bank, Commonwealth Bank, National Australia Bank and Westpac) were protected from competitive pressures by a long-stand- ing government policy against mergers that would result in the combination of any two of them. Deregulation and conversion to publicly listed companies significantly affected how all banks competed. During 2003 and 2004, a large Australian bank began to notice that its credit cards portfolio was losing customers at an alarmingly higher rate than its competitors. Profitability was also dete- riorating. An internal review indicated that while William M Student is a Regional Business Center for MasterCard Advisors the profil Sarf MasterCard Worldwid e for tralia and New Zealand Contact him at bill saubermastercard.com Art-Max 2009 BANK ACCOUNTING & PANCE 33 2 paye Page View A Read Credit Cards Exhibit 1. Cumulative Cardholder Attrition by Deciles 100% Cumulative Percentage of Attitors 80% centage 90% +. 50% 40% . 30% . 20% 10% +. 10 20% 30% 30% 70% 80% 90% 100% 40% 50% 60% Attrition-Score Decile Bins Development Validation - Baseline there were some product gaps in the bank's offer ings, that factor alone could not explain such a rise in cardholder attrition. Further reviews suggested needed improvements in training and scripting for the bank's retention unit, but implementing such improvements did not stem the flow. The bank the amount of data they generate that reflects card holder behavior over a period of time. This includes purchase-transaction data, of course. To analyze voluntary attrition, however, it turns out that other kinds of information have a stronger bearing on the ability to predict a cardholder's behavior. wu/Downloads/ContentServer.pdf - + improvements did not stem the flow. The bank also noticed that in the months immediately after customers had closed their credit card accounts, many of them moved other banking products and services to competitors. The bank needed to take action but felt that a blanket approach to customer attrition would be costly and ineffective. The bank engaged MasterCard Advisors to help it develop a solution to its credit card portfolio's attrition problem. Our charge was to help the bank identify which profitable customers were most likely to close their credit card accounts, so that the bank could take preventative measures. Fit to page Page view A Read alou wwwwwwwwwwwwwww ability to predict a cardholder's behavior. We identified five broad categories of bank cardholder data as having a potential bearing on pro- spective cardholder attrition: demographics; overall spending-and-balance growth or reduction; recent payment pattems, annual fee; and reward accumula- tion and redemption behavior. Some variables, such as age, postal code or current credit line, were static. Others, such as the number of consecutive months of balance decreases, were derived. More than 50 variables within these broad data categories were reviewed. Each was individually assessed as to its impact on voluntary attrition. Eventually, we tested strings of variables that together supported a logi- cal "story" explaining likely cardholder propensity toward attrition Of the original 50 variables, 11-with at least one from each of the five initial data categories were selected to develop an attrition model that segregates accounts into Attrition-Score Decile Bins that reflect Using Data to Produce Actionable Insights One of the remarkable attributes of payment-card products in general, and credit cards in particular, is Art-M 2009 34 BANK ACCOUNTING & FINANCE Downloads/ContentServer.pdf - + Fit to page Page view A Exhibit 2. Net Profit Margin vs. Attrition Risk Attrition 7.5% Rate(%) Net Profit Margin (%) 7.0% Net Profit +6.5% + 6.0% +5.5% Attrition Rate + 5.0% 78 Attrition Score Decile (High Risk to Low Risk) Going Beyond the Basics of Customer Profitability the likelihood of accounts to voluntarily attrite. Ex- hibit 1 shows the results of the attrition model. The attrition-propensity model has strong predie tive power: The bottom two deciles (ie., 10 percent and 20 percent) predict 55 percent of likely voluntary account closers. The development curve is a plot of randomly selected accounts using the values deter- mined by the model versus actual attrition behavior The validation plot is a second set of randomly selected accounts that are run through the model in the same manner. The closeness of these plot lines is another indication of the strength of the predictive power of the model On the revenue side, we considered net-interest income, annual fees and exception fees for late pay- ments and overlimit situations as well as interchange income. Costs included an allocation for per account service and maintenance, as well as an allocation for the cost of rewards for those accounts with associ- ated rewards. In addition, a change for actual and prospective losses was reflected for accounts at a certain status as determined by the bank's credit - + ht to page Page view A Red wower anuncation or the strengen or the predictive prospective losses was reflected for accounts at a power of the model. certain status as determined by the bank's credit- The results of this model indicate that it is indeed monitoring systems. possible to identify with a high degree of accuracy There were now two interrelated data plots at the which accounts are most likely to be closed by their individual customer level that could be included on owners. On the strength of these results, our cli the same chart: attrition propensity (black line) and ent's card-management team was prepared to focus account profitability as defined by net-profit margin massive, across-the-board retention programs on (gray line)(Exhibit 2). the bottom two attrition-score deciles immediately. This information significantly complicated the In the bank's view, the first question posed in our bank's plans to stem attrition in its cards portfolio discussions had been answered, and the top eight by focusing on only attrition-score deciles 1 and 2. deciles could be considered "safe." Because the bank As a result of this additional analysis, the bank was considered the accounts in the top eight deciles safe, instead prepared to abandon customers who placed it believed that the first question (ie, "How much in the top and bottom attrition-score deciles (ie., 1 should a bank spend on a customer who is unlikely and 10) because of their lack of profitability. In ad- to leave?") had been answered: "Nothing!" dition, the bank was not totally convinced of the APRIL-MAY 2009 BANK ACCOUNTING & FINANCE 35 - + Fit to page Page view A Re Exhiblt 3. Profit Grouping vs. Attrition Risk Profit Distribution 100% 02 H - 80% 70% High Profit Moderate Profit Low/Moderate Profit Low Profit Negative Profit Attrition Score Decile (high risk to low risk) Note: Shading in bars indicates profitability, from negative profit (darkest) to high profit (lightest). in the first and 10th. That is, the current profiles and behaviors in these two deciles indicated that these customers, given time, would likely transition into the first or 10th deciles. So, while there was not yet a clear case for writing them off, they were headed in the wrong direction. Or so it seemed value of the customers in the second attrition-score decile. Further analysis of this information began to provide a clearer picture of the attrition and profit ability dynamics in the portfolio The customers in the first decile, it turned out, were typically younger than the portfolio average and had taken the card because it was the first one for which they were eligible. As they became more creditworthy, they received other, competitive card offers. Further, they were not offered credit line increases as frequent- ly as the portfolio average, so they began redeeming the rewards points they had earned and paying off increasingly larger portions of their balances. This had the effect of reducing their profitability. The final trigger for attrition among these customers was- almost universally the short time remaining until Finding Profitable Customers Throughout the Attrition Propensity Scale Our analytical effort had revealed those customers who had a high propensity for voluntary attrition and their associated net-profit margins. The bank was prepared to focus its retention programs on wewujuownloads/ContentServer.pdf - + almost universally-the short time remaining until the anniversary date for the annual card fee. In the 10th decile, analysis revealed almost exactly the opposite situation. The customers in this group were somewhat older than the portfolio average They tended to be long-standing bank customers who almost never carried balances on their cards. They were frequently offered credit line increases. These customers spent a lot on their cards, despite not carrying balances, and also earned a lot of re- wards points, which they were very savvy about redeeming. This is the definition of a classic credit card "transactor." These customers showed almost no triggers for attrition. Customers in the second and ninth deciles were each on the way to "maturing" into the profiles found Fit to page D Page view | A Reada was prepared to focus its retention programs on customers who fell squarely in the large and profit- able middle of the attrition-propensity scale. The cardholders at each end of the scale-.e, in the first and 10th deciles-would receive little, if any, reten tion investment However, the bank believed that there were probably some profitable customers worth trying to retain--particularly in the second and ninth attrition-score deciles. The key would be to develop intervention tactics that might mitigate the slow, steady drift of these customers into the less profit- able first or 10th deciles. A distribution of net-profit margin was con- ducted within the attrition scale to examine the profit contribution of all customers in more de- APOL-MAY 2009 36 BANK ACCOUNTING & FINANCE + Fit to page Page view | A Read alou - Expected Lost Profit vs. Attrition Score Exhibit 31.000 3.500 O e re SEBE tail Bank customers were aggregated into five groupings, ranging from negative profit to high profit (Exhibit 3). Customers in every attrition-score decile exhibited the full range of net-profit-margin con- tributions. In the first decile, nearly 35 percent of customers were either moderately or highly profitable. Even within the 10th decile, in which nearly 40 percent of the customers were unprofit able, there were other customers approximately 30 percent--who were either moderately or highly profitable. The issue of how best to target reten attrition-score decile six and found that they were virtually identical, except that those in decile 6 were five to 10 years older. The intensive analytical efforts were beginning to yield important insights. It was clear that many of the negative profitability customers across all attrition-score deciles were entrenched in their be haviors and that little should be done to stop them from moving their business to another bank. There were also highly profitable customers who fell into attrition-score deciles four through seven but were not at significant risk of voluntarily closing their - + Fit to page Page view | A Read prohtable. The issue of how best to target reten- not at significant risk of voluntarily closing their ac- tion efforts was becoming progressively more counts. These customers needed to be made to feel complicated. Simply giving up on customers at more appreciated. the extremes of the attrition distribution risked Furthermore, despite the current net-profit con- the bank's losing significant numbers of customers tributions of customers in various attrition deciles, and, more important, profits. it was clear that customer behaviors altered over Given the variability of customer profitability time. Many of the negative-profit customers who within each decile, the simple attrition-score decile fell into attrition-score decile 1 were verging on screen was not fine enough to provide sufficient becoming highly creditworthy, with incomes and guidance for retention initiatives. The sample pro cardholder-behavior trajectories that would make files of customers falling into the negative-profit them some bank's prized customer within five to 10 and high-profit categories across the attrition-score years. At the other end of the attrition scale, many deciles were highly similar. In addition, we compared customers who did not currently carry balances had, customers in the negative profitability category of however, carried medium-to-large balances in the decile one with highly profitable customers from not-too-distant past. Therefore, successful retention BAX ACCOUNTINC & P C 37 APRIL-MAY 2009 - + initiatives would have to be informed by some kind of potential-profitability metric that reflected the dynamic nature of individual cardholder behavior over time. Finding a Way to Identify Future Profitability The task now was to devise a means to achieve two objectives simultaneously: minimizing the risk of future cardholder attrition while maximizing their future profitability. With the ability to predict the likelihood of attrition well developed at this point, we focused on developing a measure of estimated potential profitability. To do this, we used the existing net-margin-con- tribution model developed as a starting point. Into that, we incorporated the profitability paths over time of customers in key demographic groups For example, some customers started in negative profitability but migrated to high profitability over time; others started as highly profitable but descended into negative profitability. Many, of course, started and stayed either moderately prof itable or negatively profitable. From this effort a view of future profitability began to come into focus. Next, we added a measure to reflect po tential credit-quality decay and associated losses over time. The final result was a measure of risk- adjusted, estimated potential profitability. This "probability of attrition" was a more precise measure and so replaced the broader attrition-score deciles. Indeed, the probability of attrition was converted into an attrition score that resembled the Fit to page Page view A Read al profit score meant that the bank would actually gain by losing that customer. We graphed these two retention-related values for each cardholder: an attrition score ranging from 600 to 780, plus an expected-lost-profit value expressed in dollars, ranging from -$500 to $1,000 (Exhibit 4). The expected-lost-profit amount is cumulative and projected over a three-year period. We found that the approximate area between attrition scores 630 to 740 and expected-lost-profit values from $50 to $900 represents the bank reten- tion effort's "sweet spot." Customers who placed in this area represented the bulk of the potential profit to the bank's card business over a three-year horizon. The lost-profit index values allow the bank to target both proactive- and reactive-reten- tion programs at their best potential customers. Employing these insights tactically, the bank used the attrition score and expected-lost-profit indexes to develop scripts for its call-center retention staff- ers that presented a range of offers to customers to maintain their accounts. Reflecting individual cus- tomers' actual value to the bank, the offers all had associated financial impacts that were ranked from least expensive to the bank to most expensive. For example, a customer with an attrition score of 670 and an expected-lost-profit value of $610 might initially be offered a one-year annual-fee waiver valued at a cost of $80 to the bank. The escalation might be to a 150-basis-point reduction in the interest rate on their account, which had an expected cost of $310 over three years to the bank. A less valuable customer with an attrition score of 750 and an expected-lost-profit value of -5260 might be offered only a restatement of the benefits u/Downloads/ContentServer.pdf - + converted into an attrition score that resembled the bank's initial credit-application and cardholder behavior scores. A low attrition score meant a higher likelihood of eventual attrition. All of the attrition- propensity measures were developed using the same statistical methodology. The amount of expected lost profit for each cus- tomer in the portfolio was derived by multiplying their probability of attrition by their risk-adjusted estimated potential profitability. Using this metric, all accounts were placed into five bands of expect ed lost profit, ranging from high to negative. So, if a customer had a high expected-lost-profit score, they were considered an important customer to retain. Alternatively, a negative expected-lost- Fit to page D Page view A Read aloud might be offered only a restatement of the benefits associated with having the card with no financial offer even in the script Informed by these insights, the bank could now identify customers to whom it wants to express its appreciation across a range of well-defined cost al- ternatives. A customer with an attrition score of 740 and an expected-lost-profit value of $350 might get a "Thanks for Being Our Valued Customer" message on their monthly statement. However, a customer with an attrition score of 670 and an expected-lost- profit value of $820 might be offered discounted tickets to concerts or other special events not avail able to less-valuable customers. continued on page 51 AL-MAY 2009 38 BANK ACCOUNTING & FINANCE Step by Step Solution
There are 3 Steps involved in it
1 Expert Approved Answer
Step: 1 Unlock

Question Has Been Solved by an Expert!
Get step-by-step solutions from verified subject matter experts
Step: 2 Unlock
Step: 3 Unlock