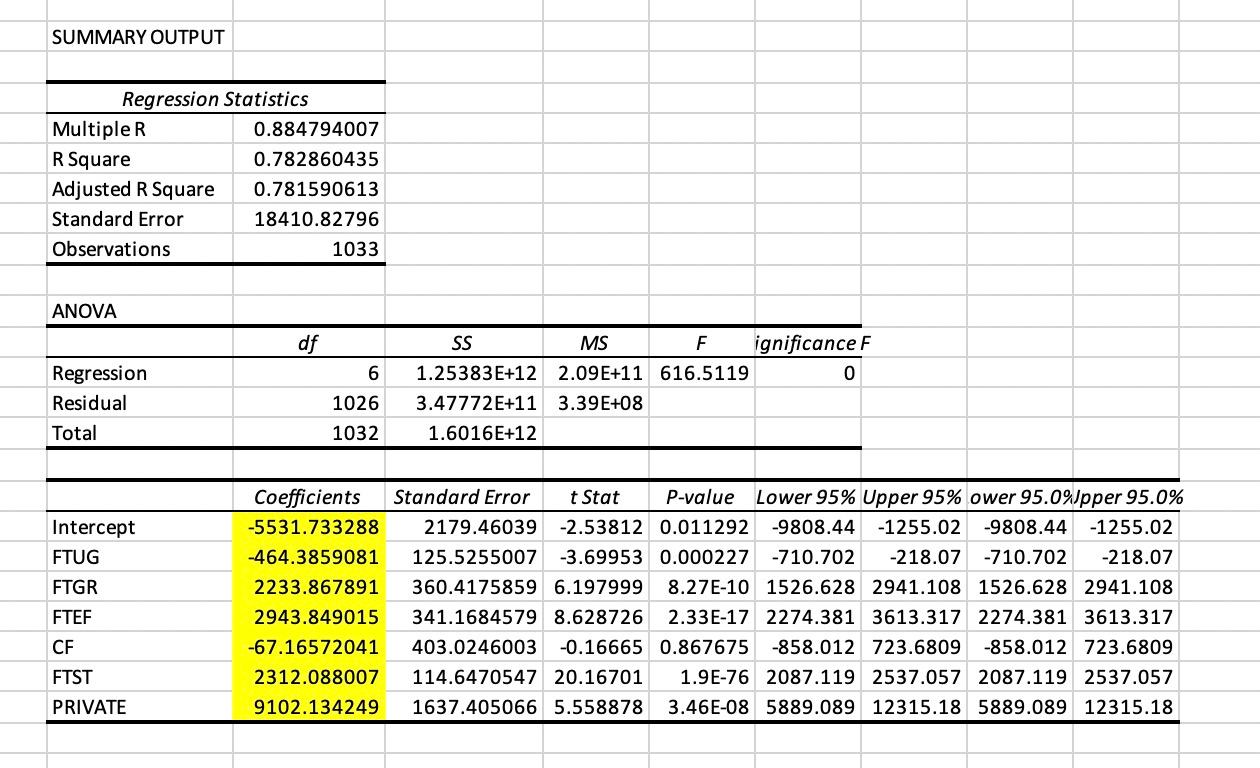
Question: SUMMARY OUTPUT Multiple R R Square Adjusted R Square Standard Error Observations ANOVA Regression Residual Total Intercept FTUG FTGR FTEF CF FTST PRIVATE Regression Statistics

SUMMARY OUTPUT Multiple R R Square Adjusted RSUMMARY OUTPUT Multiple R R Square Adjusted RSUMMARY OUTPUT Multiple R R Square Adjusted R

SUMMARY OUTPUT Multiple R R Square Adjusted R Square Standard Error Observations ANOVA Regression Residual Total Intercept FTUG FTGR FTEF CF FTST PRIVATE Regression Statistics 0.884794007 0.782860435 0.781590613 18410.82796 1033 SS MS ignificance F F 1.25383E+12 2.09E+11 616.5119 6 0 1026 3.47772E+11 3.39E+08 1032 1.6016E+12 Coefficients Standard Error t Stat P-value Lower 95% Upper 95% ower 95.0%Jpper 95.0% -5531.733288 2179.46039 -2.53812 0.011292 -9808.44 -1255.02 -9808.44 -1255.02 -464.3859081 125.5255007 -3.69953 0.000227 -710.702 -218.07 -710.702 -218.07 2233.867891 360.4175859 6.197999 8.27E-10 1526.628 2941.108 1526.628 2941.108 2943.849015 341.1684579 8.628726 2.33E-17 2274.381 3613.317 2274.381 3613.317 -67.16572041 403.0246003 -0.16665 0.867675 -858.012 723.6809 -858.012 723.6809 2312.088007 114.6470547 20.16701 1.9E-76 2087.119 2537.057 2087.119 2537.057 9102.134249 1637.405066 5.558878 3.46E-08 5889.089 12315.18 5889.089 12315.18 df How many variables (slope coefficients) were statistically significant in this model (Model 1)? QUESTION 12 What is the predicted effect of an increase in graduate students on total cost per student (TC) in dollars? Use the original scale of the the variables to answer this question. Increase or decrease Effect in dollars QUESTION 13 Report what percentage of the variation in TC = Real total cost per student is explained by the model (R-squared). Report the value with 4 decimals and in the format found in the regression output (for example 0.3456). Refer to the CollegeCost dataset. In this question, we explore some of the factors predicting costs at American universities. Let TC = Real ($2008) total cost per student FTUG = Number of full-time undergraduate students (in 1000s) FTGR = Number of full-time graduate students (in 1000s) FTEF = Number of full-time faculty per 100 students CF = Number of contract faculty per 100 students FTST = Number of full-time nonacademic staff per 100 students PRIVATE; = 1 if i is a private school; 0 if i is a public school. Estimate the linear regression of TC on the above variables and report the estimated coefficients, use the output from Excel with 2 decimals or 4 decimals for very small numbers (example: 653.47 or 0.0345), this is Model 1 Yhat = BO+B1FTUG+B2FTGR+B3FTEF+B4CF+B5FTST+B6PRIVATE+& bo= -5531.73 b1 = -464.39 b2= 2233.87 b3= 2943.85 b4= -67.17 b5= 2312.09 b6- 9102.13

Step by Step Solution

There are 3 Steps involved in it

1 Expert Approved Answer
Step: 1 Unlock blur-text-image
Question Has Been Solved by an Expert!

Get step-by-step solutions from verified subject matter experts

Step: 2 Unlock
Step: 3 Unlock

Students Have Also Explored These Related General Management Questions!