

Question: The following is a simple regression model created in Excel that attempts to estimate the capitalisation of a company (in millions) using a single
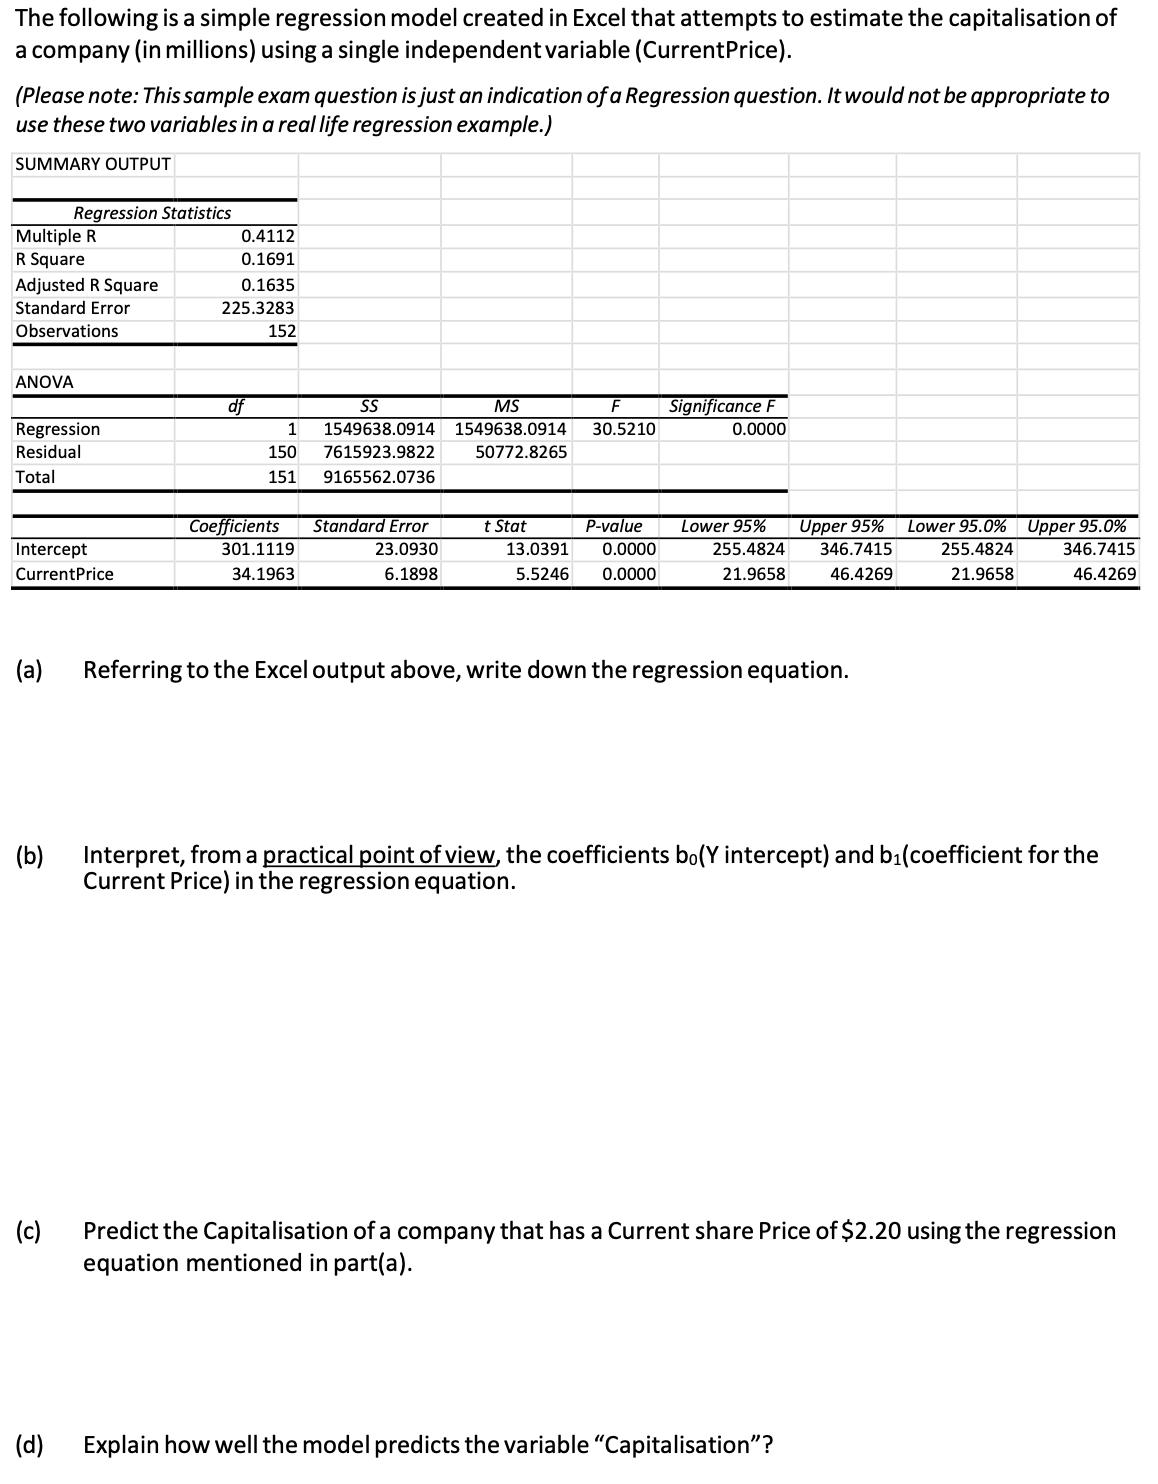
The following is a simple regression model created in Excel that attempts to estimate the capitalisation of a company (in millions) using a single independent variable (Current Price). (Please note: This sample exam question is just an indication of a Regression question. It would not be appropriate to use these two variables in a real life regression example.) SUMMARY OUTPUT Multiple R R Square Adjusted R Square Standard Error Observations ANOVA Regression Residual Total Intercept CurrentPrice (a) Regression Statistics (b) (c) (d) 0.4112 0.1691 0.1635 225.3283 152 df SS MS 1 1549638.0914 1549638.0914 30.5210 150 7615923.9822 50772.8265 151 9165562.0736 Coefficients 301.1119 34.1963 Standard Error 23.0930 6.1898 F Significance F 0.0000 t Stat 13.0391 P-value Lower 95% 0.0000 5.5246 0.0000 255.4824 21.9658 Upper 95% 346.7415 46.4269 Referring to the Excel output above, write down the regression equation. Lower 95.0% Upper 95.0% 255.4824 346.7415 21.9658 46.4269 Interpret, from a practical point of view, the coefficients bo(Y intercept) and b(coefficient for the Current Price) in the regression equation. Explain how well the model predicts the variable "Capitalisation"? Predict the Capitalisation of a company that has a Current share Price of $2.20 using the regression equation mentioned in part(a).
Step by Step Solution
3.37 Rating (153 Votes )
There are 3 Steps involved in it
a The regression equation is 3011119 341963 Current Price Where is the Predicted Capitliasiation of ... View full answer

Get step-by-step solutions from verified subject matter experts