

Question: Suppose 2: is the standard normal variable. Draw the normal cu rue for each of the following probabilityr statements to visualize the required area. Report
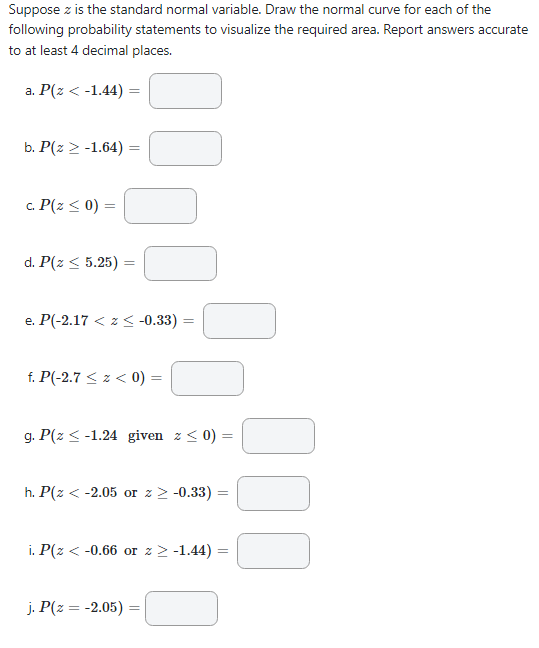

Suppose 2: is the standard normal variable. Draw the normal cu rue for each of the following probabilityr statements to visualize the required area. Report answers accurate to at least 4 decimal places. as\" 4.44} = Cl saga1.54}: C] c. p.135 1}) = C] we 5.25; = C] Ems-,- .: z s -033; = C] r. 1:14.: g 2: a: a} = C] gaze1.24 given 2:110}: C] h. a; s. ear: or z :3 41.33) = Cl 1.13.1\" .0155 or z 2-1.44): C] j. p.13 = -1115} = C]
Step by Step Solution
There are 3 Steps involved in it
1 Expert Approved Answer
Step: 1 Unlock

Question Has Been Solved by an Expert!
Get step-by-step solutions from verified subject matter experts
Step: 2 Unlock
Step: 3 Unlock