

Question: Suppose a dataset is a realization of a random sample X1, X2,...,Xn from a uniform distribution on [0, ?], for some (unknown) ? > 0.
Suppose a dataset is a realization of a random sample X1, X2,...,Xn
from a uniform distribution on [0, ?], for some (unknown) ? > 0. We test
H0 : ? = 5 versus H1 : ? = 5.
a. We take T1 = max{X1, X2,...,Xn} as our test statistic. Specify what
the (relevant) possible values are for T and which are in favor of H0 and
which are in favor of H1. For instance, make a picture like Figure 25.1.
b. Same as a, but now for test statistic T2 = |2Xn ? 5|.
25.6 To test a certain null hypothesis H0 one uses a test statistic T with
a continuous sampling distribution. One agrees that H0 is rejected if one
observes a value t of the test statistic for which (under H0) the right tail
probability P(T ? t) is smaller than or equal to 0.05. Given below are different
values t and a corresponding left or right tail probability (under H0). Specify
for each case what the p-value is, if possible, and whether we should reject H0.
a. t = 2.34 and P(T ? 2.34) = 0.23.
b. t = 2.34 and P(T ? 2.34) = 0.23.
c. t = 0.03 and P(T ? 0.03) = 0.968.
d. t = 1.07 and P(T ? 1.07) = 0.981.
e. t = 1.07 and P(T ? 2.34) = 0.01.
f. t = 2.34 and P(T ? 1.07) = 0.981.
g. t = 2.34 and P(T ? 1.07) = 0.800.
25.7 (Exercise 25.2 continued). The number of births in September is modeled by a Poisson random variable T with parameter , which represents the
expected number of births. Suppose that one uses T to test the null hypothesis H0 : = 1472 and that one decides to reject H0 on the basis of observing
the value t = 1718.
a. In which direction do values of T provide evidence against H0 (and in
favor of H1)?
b. Compute the p-value corresponding to t = 1718, where you may use the
fact that the distribution of T can be approximated by an N(, ) distribution.
Polygraphs that are used in criminal investigations are supposed to indicate whether a person is lying or telling the truth. However the procedure
is not infallible, as is illustrated by the following example. An experienced
polygraph examiner was asked to make an overall judgment for each of a
total 280 records, of which 140 were from guilty suspects and 140 from innocent suspects. The results are listed in Table 26.2. We view each judgment
as a problem of hypothesis testing, with the null hypothesis corresponding to
"suspect is innocent" and the alternative hypothesis to "suspect is guilty."
Estimate the probabilities of a type I error and a type II error that apply to
this polygraph method on the basis of Table 26.2.
26.2 Consider the testing problem in Exercise 25.11. Compute the probability
of committing a type II error if the true value of is 1.
26.3 One generates a number x from a uniform distribution on the interval
[0, ?]. One decides to test H0 : ? = 2 against H1 : ? = 2 by rejecting H0 if
x ? 0.1 or x ? 1.9.
a. Compute the probability of committing a type I error.
b. Compute the probability of committing a type II error if the true value
of ? is 2.5
![a uniform distribution on [0, ?], for some (unknown) ? > 0.](https://dsd5zvtm8ll6.cloudfront.net/si.experts.images/questions/2024/09/66ef423286bf0_08266ef423275955.jpg)
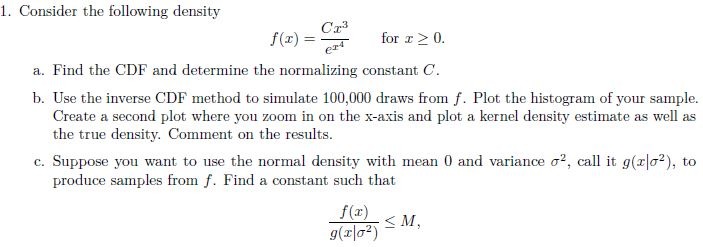
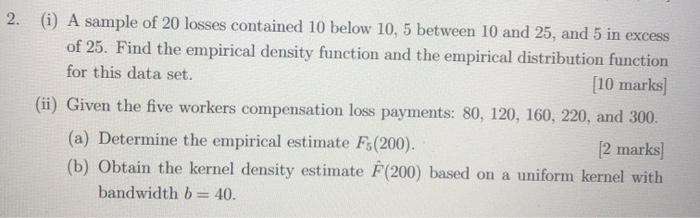
2. (i) A sample of 20 losses contained 10 below 10, 5 between 10 and 25, and 5 in excess of 25. Find the empirical density function and the empirical distribution function for this data set. [10 marks (ii) Given the five workers compensation loss payments: 80, 120, 160, 220, and 300. (a) Determine the empirical estimate Fs(200). [2 marks (b) Obtain the kernel density estimate F(200) based on a uniform kernel with bandwidth b = 40.1. Suppose a probability density function for Y is given by p(y|0) = c(0)k(0, y), for some functions c(.) and k(.), where c(0) does not depend on Y. Then k(0, y) is said to be the kernel of the distribution, and p(y|0) o k(0, y). For each of the following distributions, write down the probability density function and find the kernel: (a) Y|0 - Po(0) (b) X|0, b ~ Beta (b0, b) (c) @ |a, b, y ~ Gamma(a + y + 1,b - 3y) (d) plu, x, t - N(tu + (1 - 1)x, x2T-2)1. Consider the following density Cr3 f(x) = for I > 0. a. Find the CDF and determine the normalizing constant C. b. Use the inverse CDF method to simulate 100,000 draws from f. Plot the histogram of your sample. Create a second plot where you zoom in on the x-axis and plot a kernel density estimate as well as the true density. Comment on the results. c. Suppose you want to use the normal density with mean 0 and variance o?, call it g(x o?), to produce samples from f. Find a constant such that f(x) g(1/02)
Step by Step Solution
There are 3 Steps involved in it

Get step-by-step solutions from verified subject matter experts