

Question: Suppose f(:L') = E. (a) The rectangles in the graph on the left illustrate a left endpoint Riemann sum for f(a:) on the interval 3

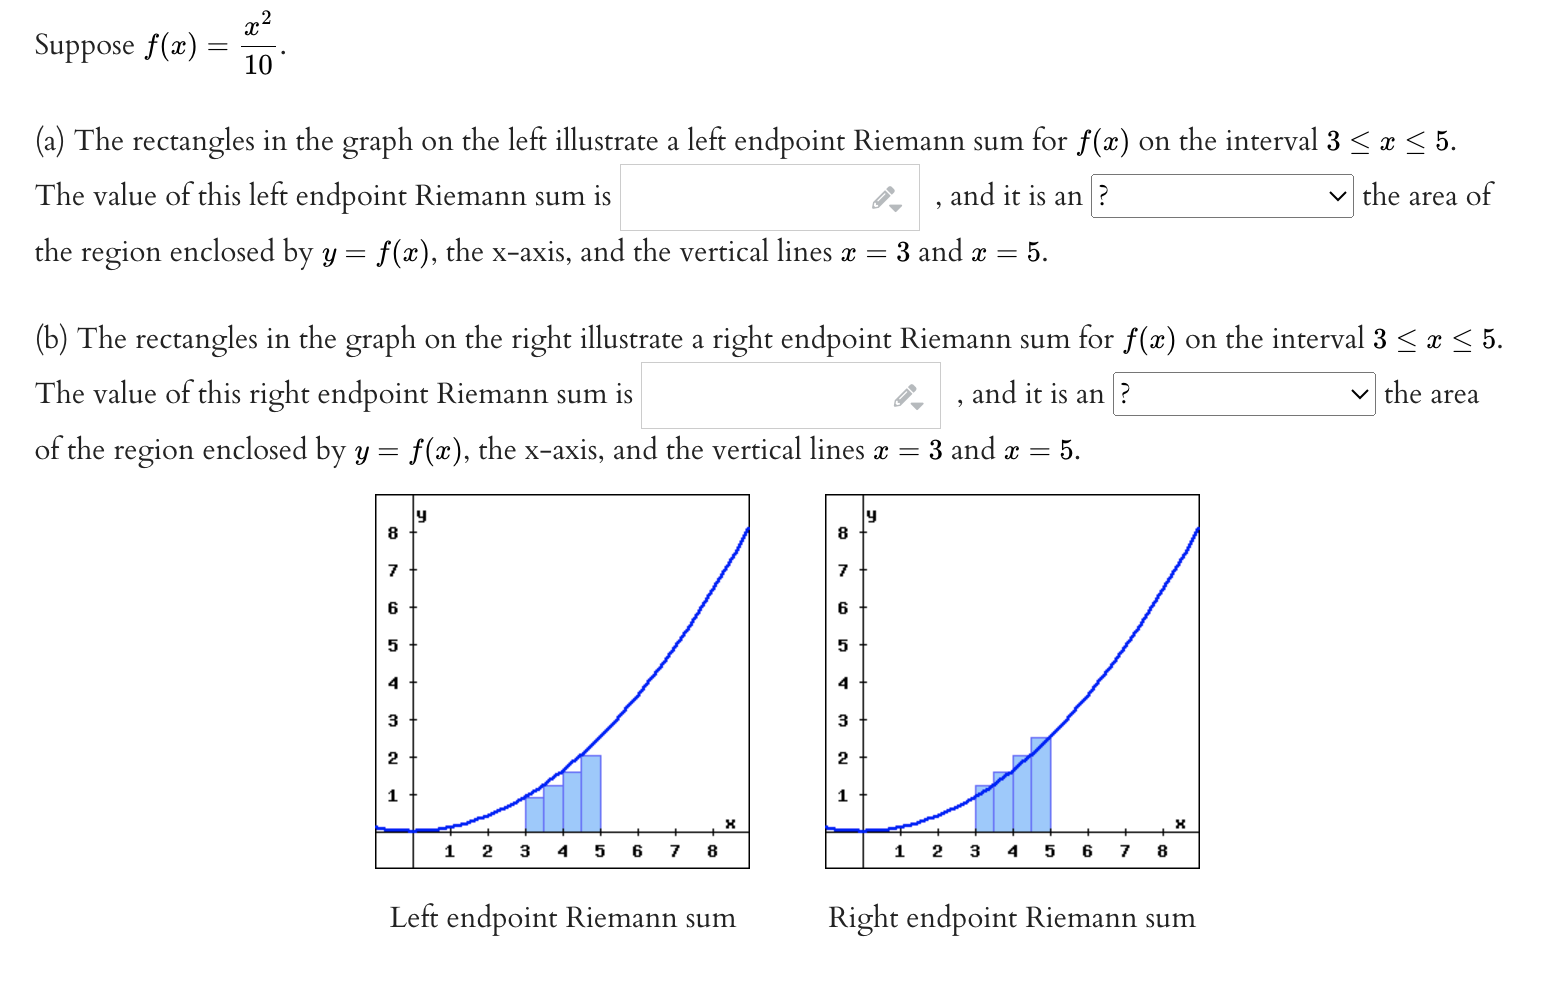
Suppose f(:L') = E. (a) The rectangles in the graph on the left illustrate a left endpoint Riemann sum for f(a:) on the interval 3 S :L' S 5. The value of this left endpoint Riemann sum is , and it is an the area of the region enclosed by y = f(:r:), the xaxis, and the vertical lines a: = 3 and a; = 5. (b) The rectangles in the graph on the right illustrate a right endpoint Riemann sum for f(.1') on the interval 3 g .7; S 5. The value of this right endpoint Riemann sum is , and it is an the area of the region enclosed by y = f(L'), the xaxis, and the vertical lines a\": = 3 and a: = 5. s a 7 7 a a 5 5 4 4 3 3 2 2 1 1 Left endpoint Riemann sum Right endpoint Riemann sum
Step by Step Solution
There are 3 Steps involved in it

Get step-by-step solutions from verified subject matter experts