

Question: Suppose that Goodwin Co., a U.S. based MNC, knows that it will receive 100,000 pounds in one year. It is considering a currency put option
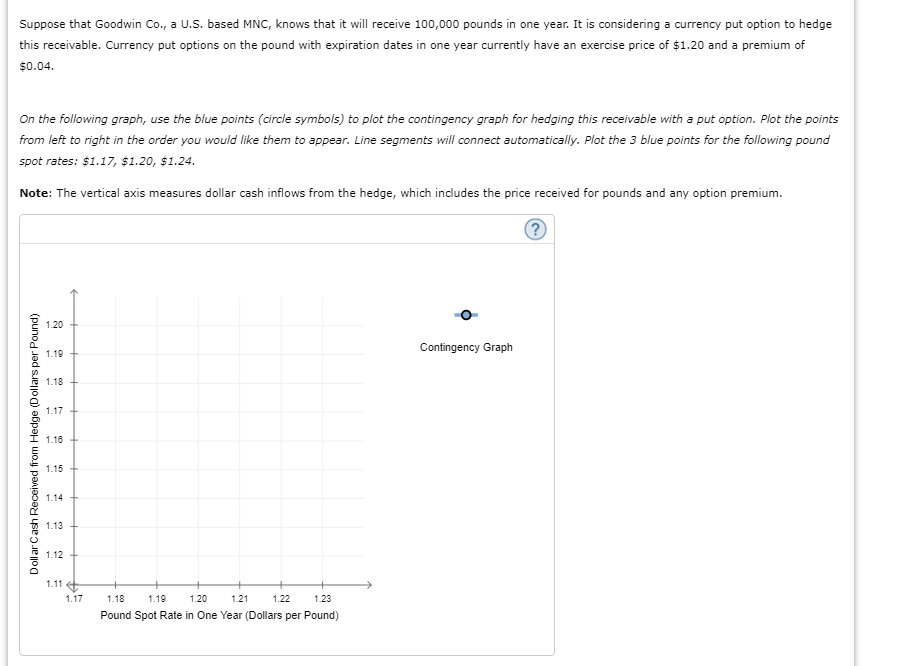
Suppose that Goodwin Co., a U.S. based MNC, knows that it will receive 100,000 pounds in one year. It is considering a currency put option to hedge this receivable. Currency put options on the pound with expiration dates in one year currently have an exercise price of $1.20 and a premium of $0.04. On the following graph, use the blue points (circle symbols) to plot the contingency graph for hedging this receivable with a put option. Plot the points from left to right in the order you would like them to appear. Line segments will connect automatically. Plot the 3 blue points for the following pound spot rates: $1.17, $1.20, $1.24. Note: The vertical axis measures dollar cash inflows from the hedge, which includes the price received for pounds and any option premium. 1.20 Contingency Graph 1.19 1.18 1.17 1.16 Dollar Cash Received from Hedge (Dollars per Pound) 1.15 + 1.14 + 1.13 1.12 1.11 1.17 1.18 1.19 1.20 1.21 1.22 1.23 Pound Spot Rate in One Year (Dollars per Pound) Suppose that Goodwin Co., a U.S. based MNC, knows that it will receive 100,000 pounds in one year. It is considering a currency put option to hedge this receivable. Currency put options on the pound with expiration dates in one year currently have an exercise price of $1.20 and a premium of $0.04. On the following graph, use the blue points (circle symbols) to plot the contingency graph for hedging this receivable with a put option. Plot the points from left to right in the order you would like them to appear. Line segments will connect automatically. Plot the 3 blue points for the following pound spot rates: $1.17, $1.20, $1.24. Note: The vertical axis measures dollar cash inflows from the hedge, which includes the price received for pounds and any option premium. 1.20 Contingency Graph 1.19 1.18 1.17 1.16 Dollar Cash Received from Hedge (Dollars per Pound) 1.15 + 1.14 + 1.13 1.12 1.11 1.17 1.18 1.19 1.20 1.21 1.22 1.23 Pound Spot Rate in One Year (Dollars per Pound)
Step by Step Solution
There are 3 Steps involved in it

Get step-by-step solutions from verified subject matter experts