

Question: Suppose that the histogram below represents students' scores on a calculus exam. 25 20 Number of Students 40-49 50-59 60-69 70-79 80-89 90-100 Test Scores
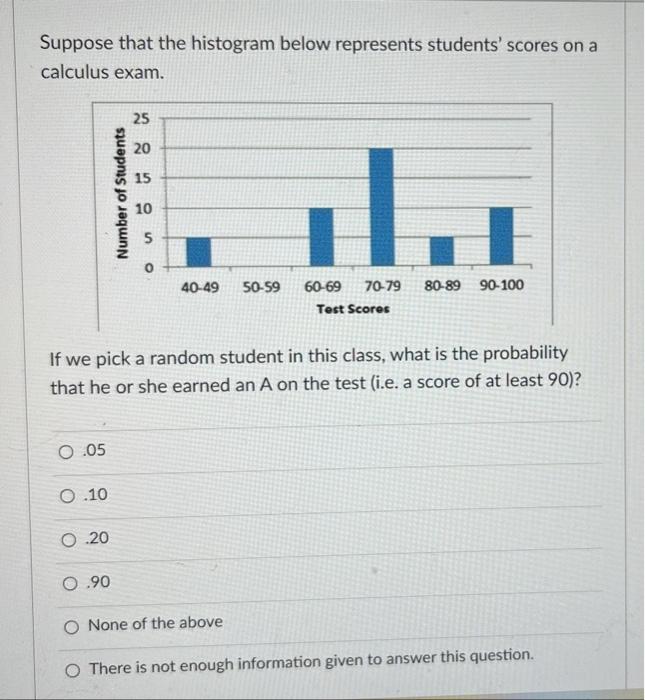
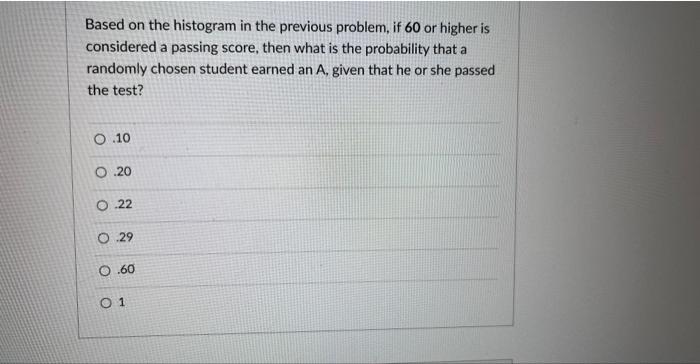
Suppose that the histogram below represents students' scores on a calculus exam. 25 20 Number of Students 40-49 50-59 60-69 70-79 80-89 90-100 Test Scores If we pick a random student in this class, what is the probability that he or she earned an A on the test (i.e. a score of at least 90)? O .05 O .10 O .20 O .90 O None of the above O There is not enough information given to answer this question.Based on the histogram in the previous problem, if 60 or higher is considered a passing score, then what is the probability that a randomly chosen student earned an A, given that he or she passed the test? O .10 O .20 O .22 O .29 O .60 O1
Step by Step Solution
There are 3 Steps involved in it
1 Expert Approved Answer
Step: 1 Unlock

Question Has Been Solved by an Expert!
Get step-by-step solutions from verified subject matter experts
Step: 2 Unlock
Step: 3 Unlock