. Suppose the difference in score (post minus pre) for all students who take the prep course...
Fantastic news! We've Found the answer you've been seeking!
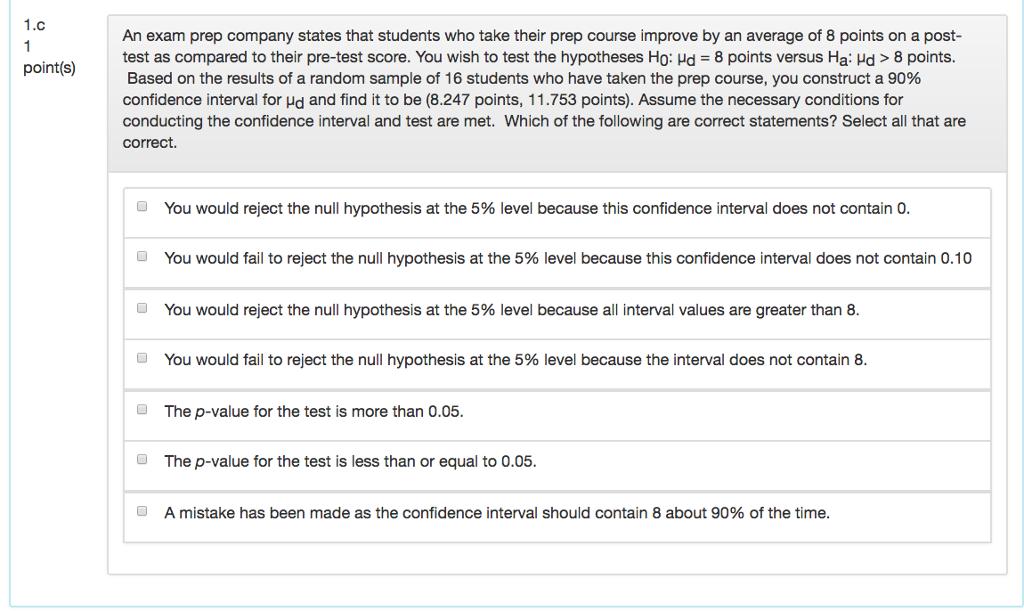
Question:
.
Transcribed Image Text:
Suppose the difference in score (post minus pre) for all students who take the prep course is known to follow a normal distribution with a known population mean difference of 8 points and a known population standard deviation of 4 points. Also, suppose the next prep course will be taken by 16 students who can be considered a random sample. Which graph below best represents the model that could be used to approximate a probability about the sample mean difference in scores (post minus prej for the 16 students? Graph A Graph B Graph C Nonal a Graph A O Graph B u Graph C Again we have that an exam prep company states that students who take their prep course improve by an average of 8 points on a post test as compared to their pre-test score. Based on historical data, it can be assumed that the difference in score (post minus prej for all students who take the prep course folows a normal distribution (with some population mean difference ud and some population standard deviation og, both of which are not known). The prep course is taken by 16 students, which can be considered a random sampie. and resulted in a sample mean difference in score (post minus pre) of 10 points and a sample standard deviation (of the pairwise differences in each student's scores) of 4 points. Which graph below best represents the model that could now be used to approximate the probabilty that, assuming the company's statement is true, the resuiting sample mean difference in scores (post minus pre) for a random sample of 16 students will be 10 points or higher (that is, to approximate the probability that, assuming the company's statement is true, of getting a sample mean difference in scores (post minus pre) for a random sample of 16 students as large as 10 points or even larger)? Graph A Graph 8 Graph C Normal a Graph A a Graph B a Graph C Saved Suppose the difference in score (post minus pre) for all students who take the prep course is known to follow a normal distribution with a known population mean difference of 8 points and a known population standard deviation of 4 points. Also, suppose the next prep course will be taken by 16 students who can be considered a random sample. Which graph below best represents the model that could be used to approximate a probability about the sample mean difference in scores (post minus prej for the 16 students? Graph A Graph B Graph C Nonal a Graph A O Graph B u Graph C Again we have that an exam prep company states that students who take their prep course improve by an average of 8 points on a post test as compared to their pre-test score. Based on historical data, it can be assumed that the difference in score (post minus prej for all students who take the prep course folows a normal distribution (with some population mean difference ud and some population standard deviation og, both of which are not known). The prep course is taken by 16 students, which can be considered a random sampie. and resulted in a sample mean difference in score (post minus pre) of 10 points and a sample standard deviation (of the pairwise differences in each student's scores) of 4 points. Which graph below best represents the model that could now be used to approximate the probabilty that, assuming the company's statement is true, the resuiting sample mean difference in scores (post minus pre) for a random sample of 16 students will be 10 points or higher (that is, to approximate the probability that, assuming the company's statement is true, of getting a sample mean difference in scores (post minus pre) for a random sample of 16 students as large as 10 points or even larger)? Graph A Graph 8 Graph C Normal a Graph A a Graph B a Graph C Saved
Expert Answer:
Answer rating: 100% (QA)
1a It is given that the difference in scores for students who take prep course follows normal distri... View the full answer
Related Book For
Posted Date:
Students also viewed these accounting questions
-
A set of observations follow a Normal distribution with mean 40 and standard deviation 4. What proportions of observations have values? (a) Greater than 46, (b) Less than 34, (c) Between 34 and 46,...
-
A population of scores forms a normal distribution with a mean of = 80 and a standard deviation of = 10. a. What proportion of the scores have values between 75 and 85? b. For samples of n = 4,...
-
Suppose x has a normal distribution with = 6. A random sample of size 16 has sample mean 50. (a) Is it appropriate to use a normal distribution to compute a confidence interval for the population...
-
Derive the velocity potential for a doublet; i.e., derive Eq. (3.88).
-
What macrobarriers and microbarriers do you think might exist for Michael Glimcher in his communication with employees?
-
A skateboarder with his board can be modeled as a particle of mass 76.0 kg, located at his center of mass (which we will study in Chapter 9). As in Figure P8.67, the skateboarder starts from rest in...
-
Determine whether each of the following is true or false. In each case, assume \(P\) is located at \(t=0\) and \(F\) is located at \(t=n\), and the \(A\) s are spread uniformly over the planning...
-
Dewitt Corporation needs to set a target price for its newly designed product M14M16. The following data relate to this new product. These costs are based on a budgeted volume of 80,000 units...
-
If it takes 4 seconds to mentally scan the distance between two locations 6 inches apart on a map, how long should it take to mentally scan locations that are 3 inches apart?
-
ers and serves as its own transfer age program for the examination of the three accounts composing stockholders' equity section of Zeitlow Corporation's balance sheet. Do not include procedures...
-
Kenya Bike Limited (KBL) assembles motor bikes using spare parts procured from China. The following data relates to the costs and number of motor bikes assembled in 2015/16 financial year. Month...
-
} ) 5. Identify what each of the following methods of the subclass do: override, hide, overload or cause a compiler error. public class ClassA { public void methodOne (int i) () public void...
-
Assume we have a $500,000 mortgage at 3.5% original interest rate, with a 30- year term and monthly payments. The interest rate can be adjusted at the end of each year, and we assume the rate...
-
Find the following: (a) In(e) (b) In(e e5) (c) In((e)4)
-
Dr. King was balancing his account based on his assets and liabilities of the medical practice he owns. If he has $100,000 in liabilities and $16,000 in net worth, what are his total amount of...
-
Consider a stock that is expected to pay a dividend of $2.76 one year from now. The dividend is expected to grow at a constant rate of 1.7% per year forever. Firms in the same industry provide an...
-
Rapid cycle improvement projects involve a series of Plan-Do-Study-Act (PDSA) improvement cycles to make incremental improvements in a process. Each improvement cycle involves a small process change...
-
Assume a simple Keynesian depression economy with a multiplier of 4 and an initial equilibrium income of $3,000. Saving and investment equal $400, and assume full employment income is $4,000. a. What...
-
Draw a graph of y = 1/x for values of x between 5 and +5.
-
Draw a histogram of the following data. Class Frequency Less than 100 ............... 120 100 or more, and less than 200 ........ 185 200 or more, and less than 300 ........ 285 300 or more, and less...
-
Hypothesis testing comes in many different forms, and it always seems to involve judgement. This makes it difficult to design a package that automatically takes data and does an appropriate...
-
The codon change (Gly-12 to Val-12) in human H-ras that converts it to oncogenic H-ras has been associated with many types of cancers. For this reason, researchers would like to develop drugs to...
-
Outline the general strategy used in metagenomics.
-
You need to understand the approach described in question 3 in More Genetic TIPS before answering this question. A muscle-specific gene was cloned and then subjected to promoter bashing. As shown...
Study smarter with the SolutionInn App