

Question: Suppose the graph below represents the function f(x). 1) Determine the open interval(s) where f(x) is increasing. Use interval notation to express your answer(s).
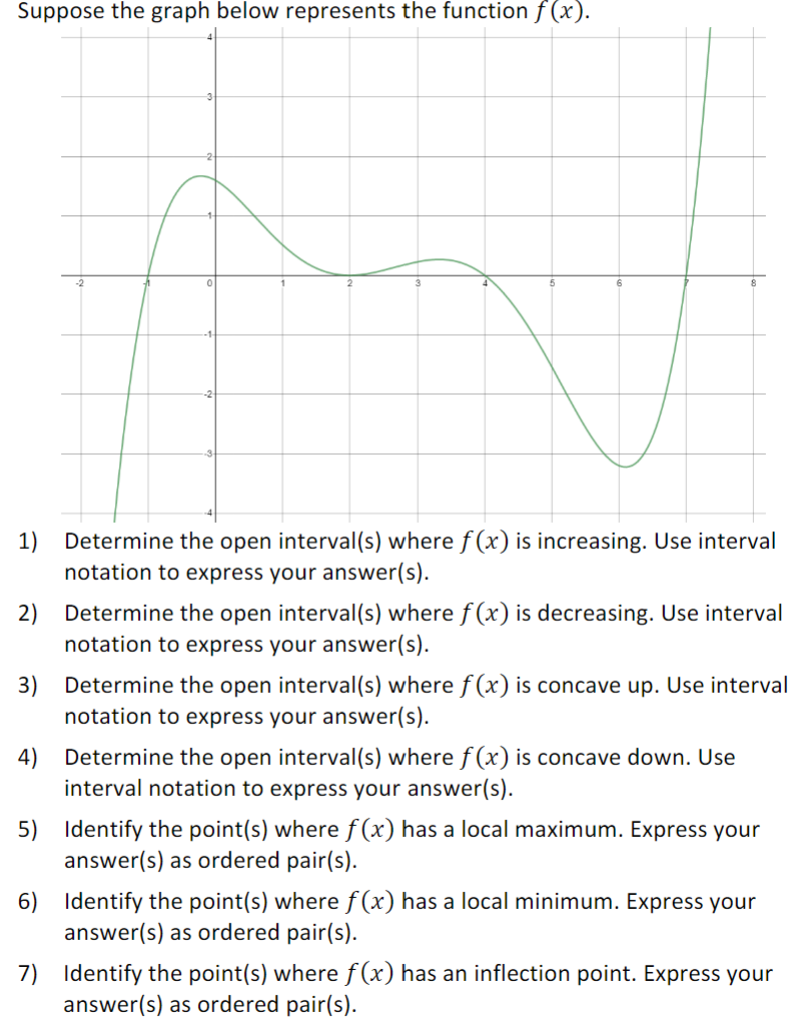
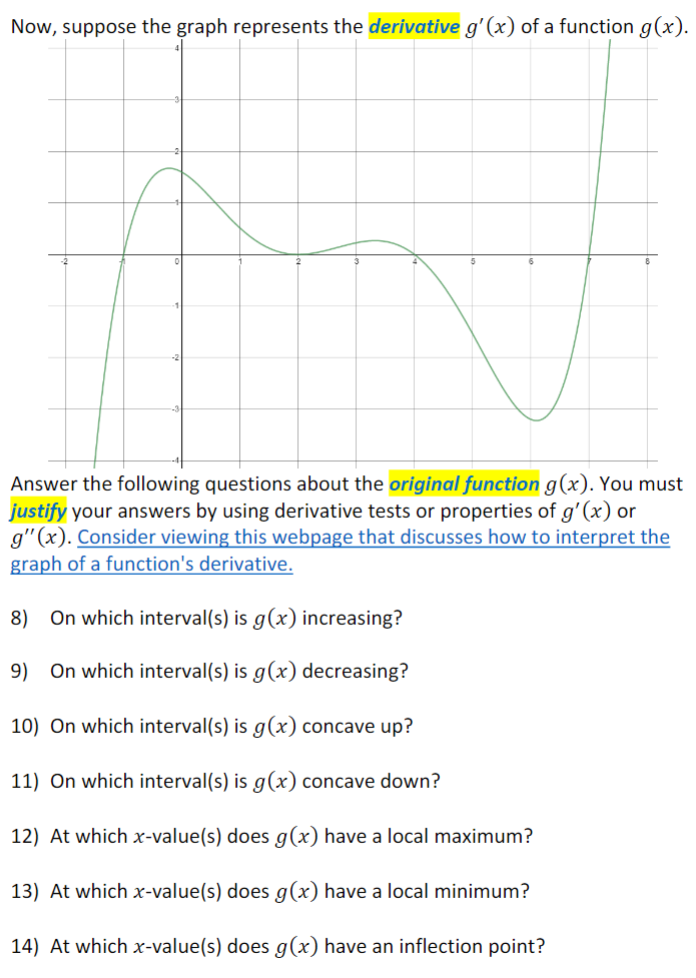
Suppose the graph below represents the function f(x). 1) Determine the open interval(s) where f(x) is increasing. Use interval notation to express your answer(s). 2) Determine the open interval(s) where f(x) is decreasing. Use interval notation to express your answer(s). 3) Determine the open interval(s) where f(x) is concave up. Use interval notation to express your answer(s). 4) Determine the open interval(s) where f(x) is concave down. Use interval notation to express your answer(s). 5) 6) Identify the point(s) where f(x) has a local maximum. Express your answer(s) as ordered pair(s). Identify the point(s) where f(x) has a local minimum. Express your answer(s) as ordered pair(s). 7) Identify the point(s) where f(x) has an inflection point. Express your answer(s) as ordered pair(s). Now, suppose the graph represents the derivative g'(x) of a function g(x). Answer the following questions about the original function g(x). You must justify your answers by using derivative tests or properties of g'(x) or g"(x). Consider viewing this webpage that discusses how to interpret the graph of a function's derivative. 8) On which interval(s) is g(x) increasing? 9) On which interval(s) is g(x) decreasing? 10) On which interval(s) is g(x) concave up? 11) On which interval(s) is g(x) concave down? 12) At which x-value(s) does g(x) have a local maximum? 13) At which x-value(s) does g(x) have a local minimum? 14) At which x-value(s) does g(x) have an inflection point?
Step by Step Solution
There are 3 Steps involved in it

Get step-by-step solutions from verified subject matter experts