

Question: Suppose we conduct a study on the time spent studying for an exam and exam scores. V survey students in introductory statistics and find the

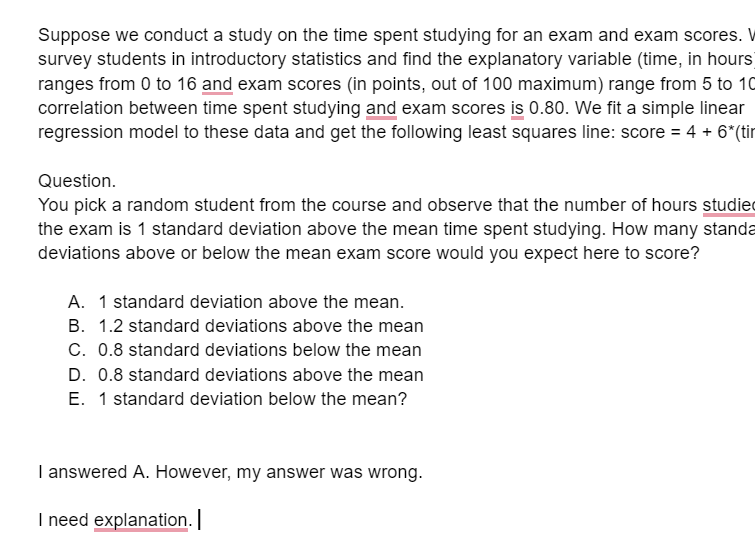
Suppose we conduct a study on the time spent studying for an exam and exam scores. V survey students in introductory statistics and find the explanatory variable (time, in hours ranges from 0 to 16 and exam scores (in points, out of 100 maximum) range from 5 to 10 correlation between time spent studying and exam scores is 0.80. We fit a simple linear regression model to these data and get the following least squares line: score = 4 + 6*(tir Question. You pick a random student from the course and observe that the number of hours studie the exam is 1 standard deviation above the mean time spent studying. How many standa deviations above or below the mean exam score would you expect here to score? A. 1 standard deviation above the mean. B. 1.2 standard deviations above the mean C. 0.8 standard deviations below the mean D. 0.8 standard deviations above the mean E. 1 standard deviation below the mean? I answered A. However, my answer was wrong. I need explanation
Step by Step Solution
There are 3 Steps involved in it

Get step-by-step solutions from verified subject matter experts