

Question: Suppose z is the standard normal variable. Draw the normal curve for each of the following probability statements to visualize the required area. Report
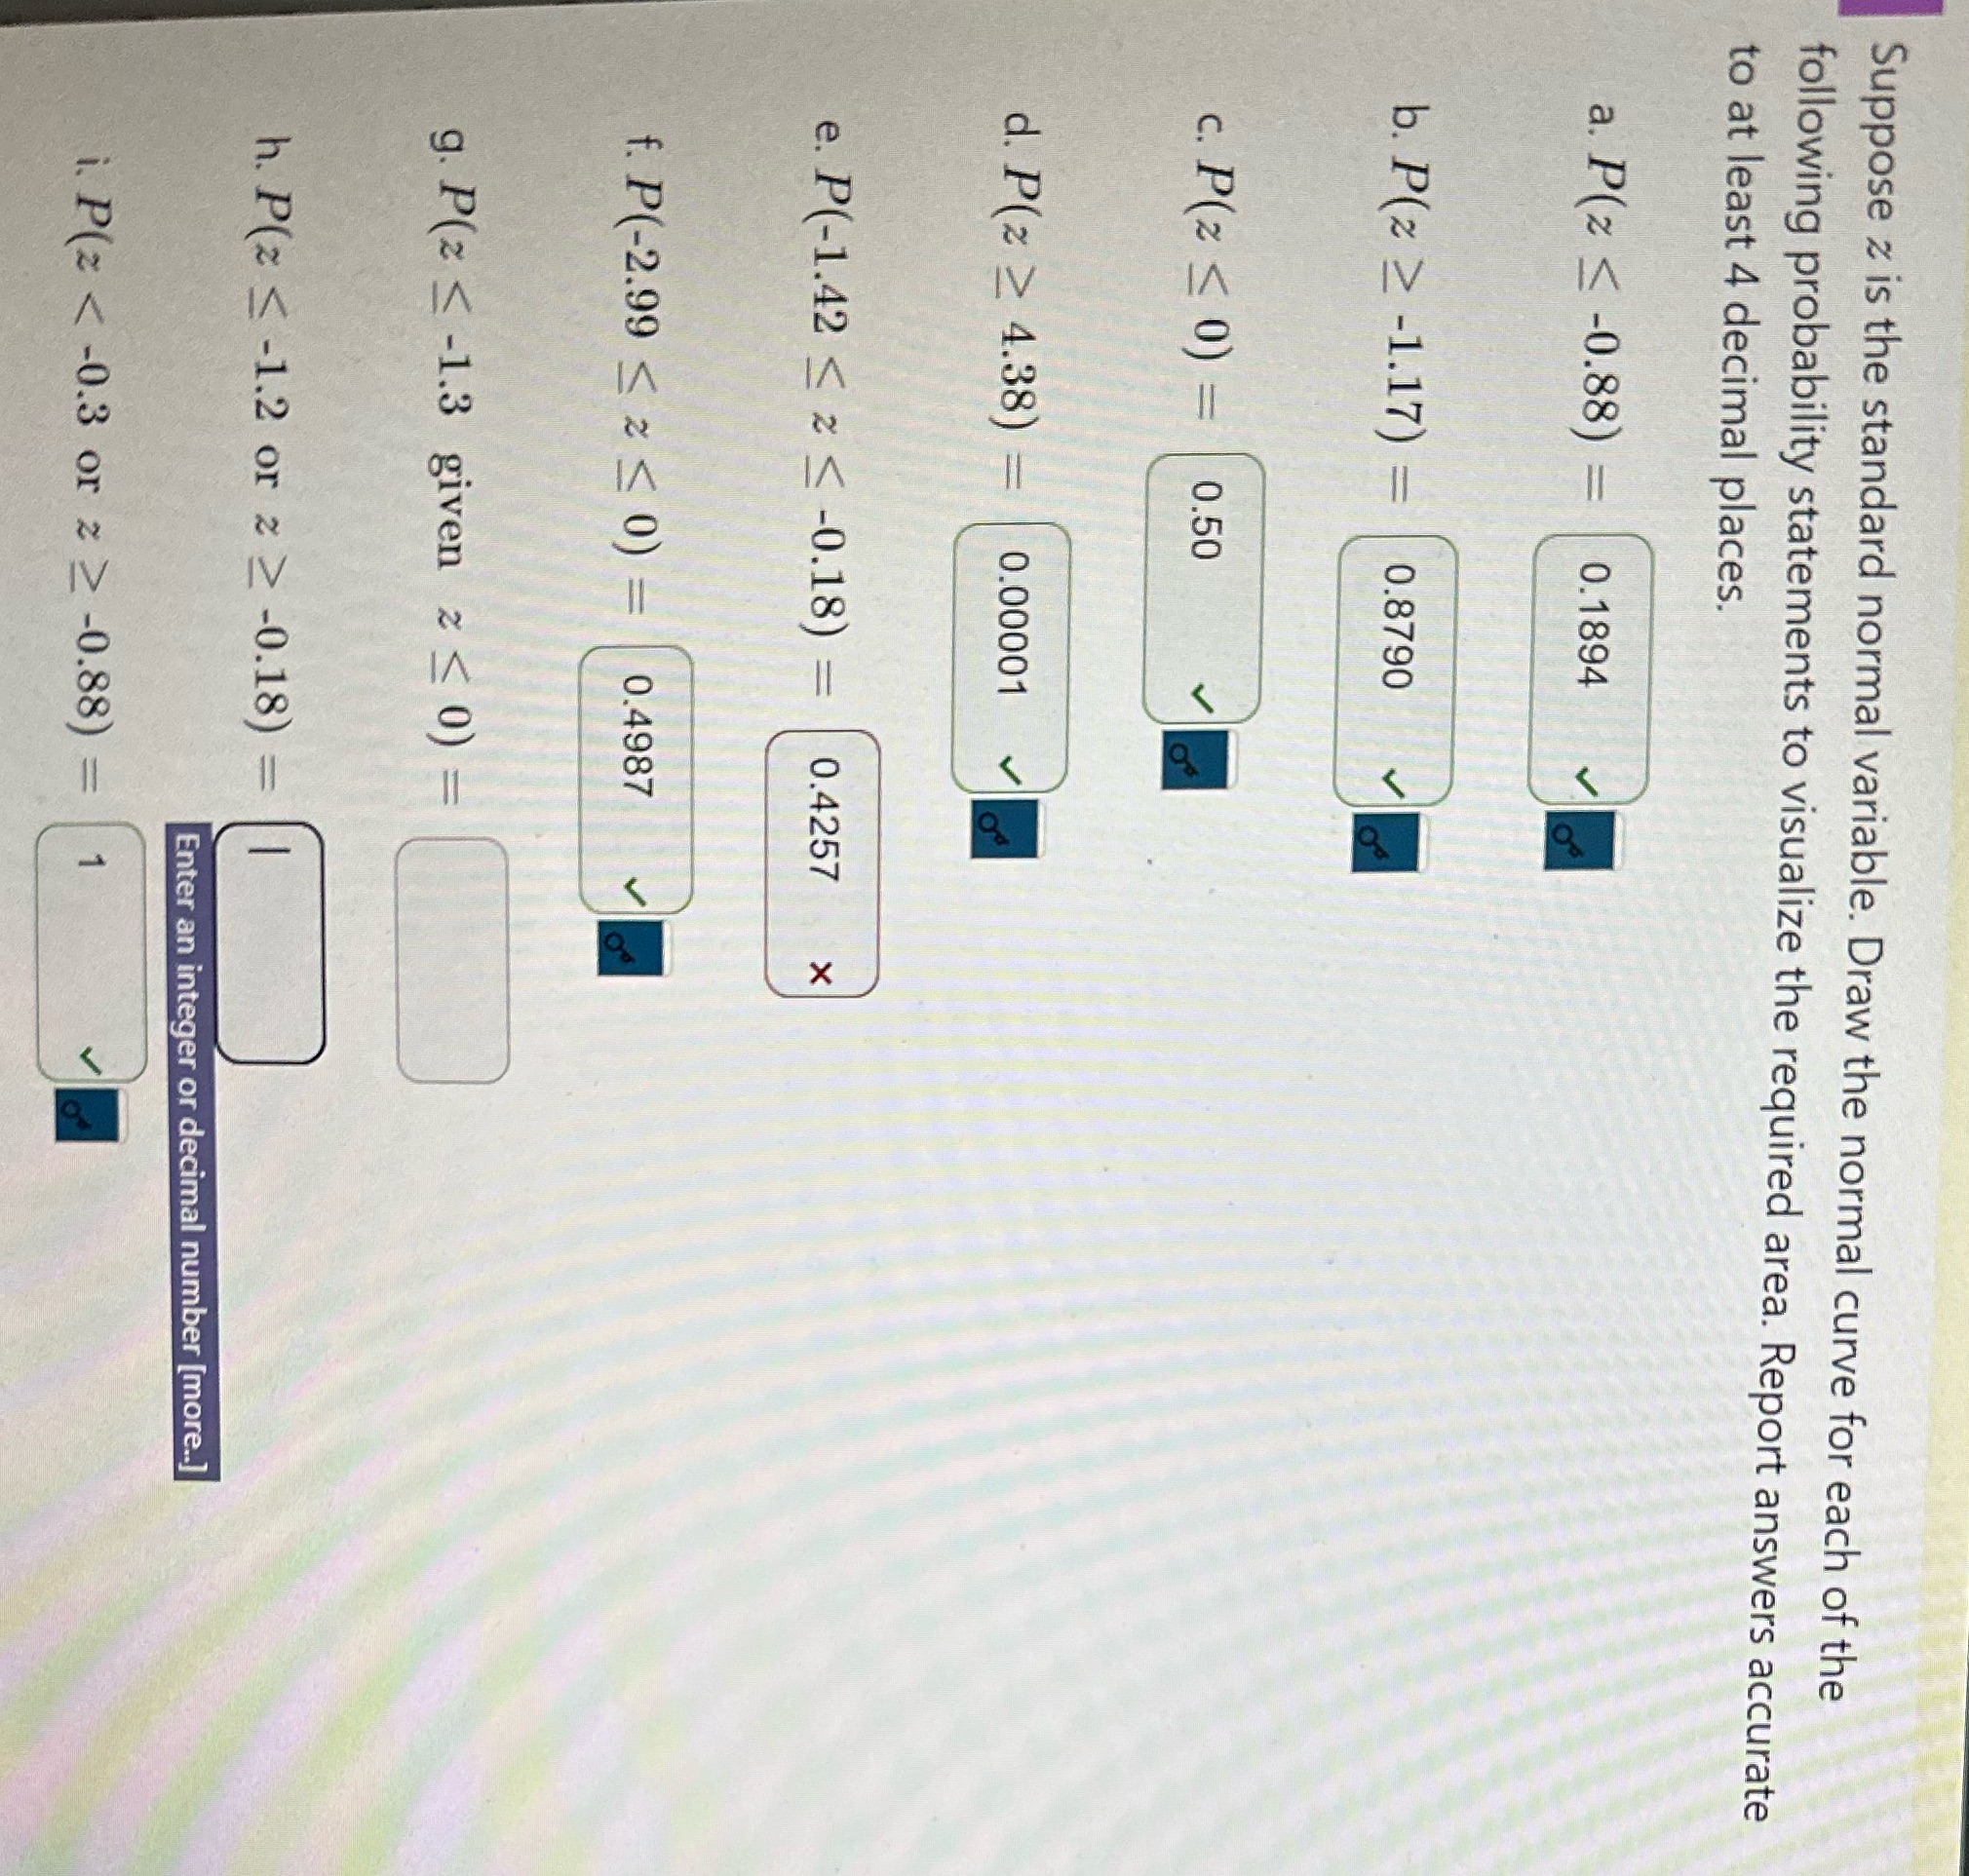
Suppose z is the standard normal variable. Draw the normal curve for each of the following probability statements to visualize the required area. Report answers accurate to at least 4 decimal places. a. P(z -0.88) = 0.1894 b. P(z -1.17) = = 0.8790 c. P(z 0) = 0.50 d. P(z 4.38) = 0.00001 e. P(-1.42 < < -0.18)= =1 0.4257 f. P(-2.99 x 0) = 0.4987 g. P(z -1.3 given < 0) = h. P(z -1.2 or z -0.18) = i. P(z < -0.3 or z -0.88) Enter an integer or decimal number [more..] 1
Step by Step Solution
There are 3 Steps involved in it
1 Expert Approved Answer
Step: 1 Unlock

Question Has Been Solved by an Expert!
Get step-by-step solutions from verified subject matter experts
Step: 2 Unlock
Step: 3 Unlock