

Question: sure to include graph title and labels, and explain your choice of graph. (15 points) (b) Compute the average, median, Ist quartile, 3rd quartile and

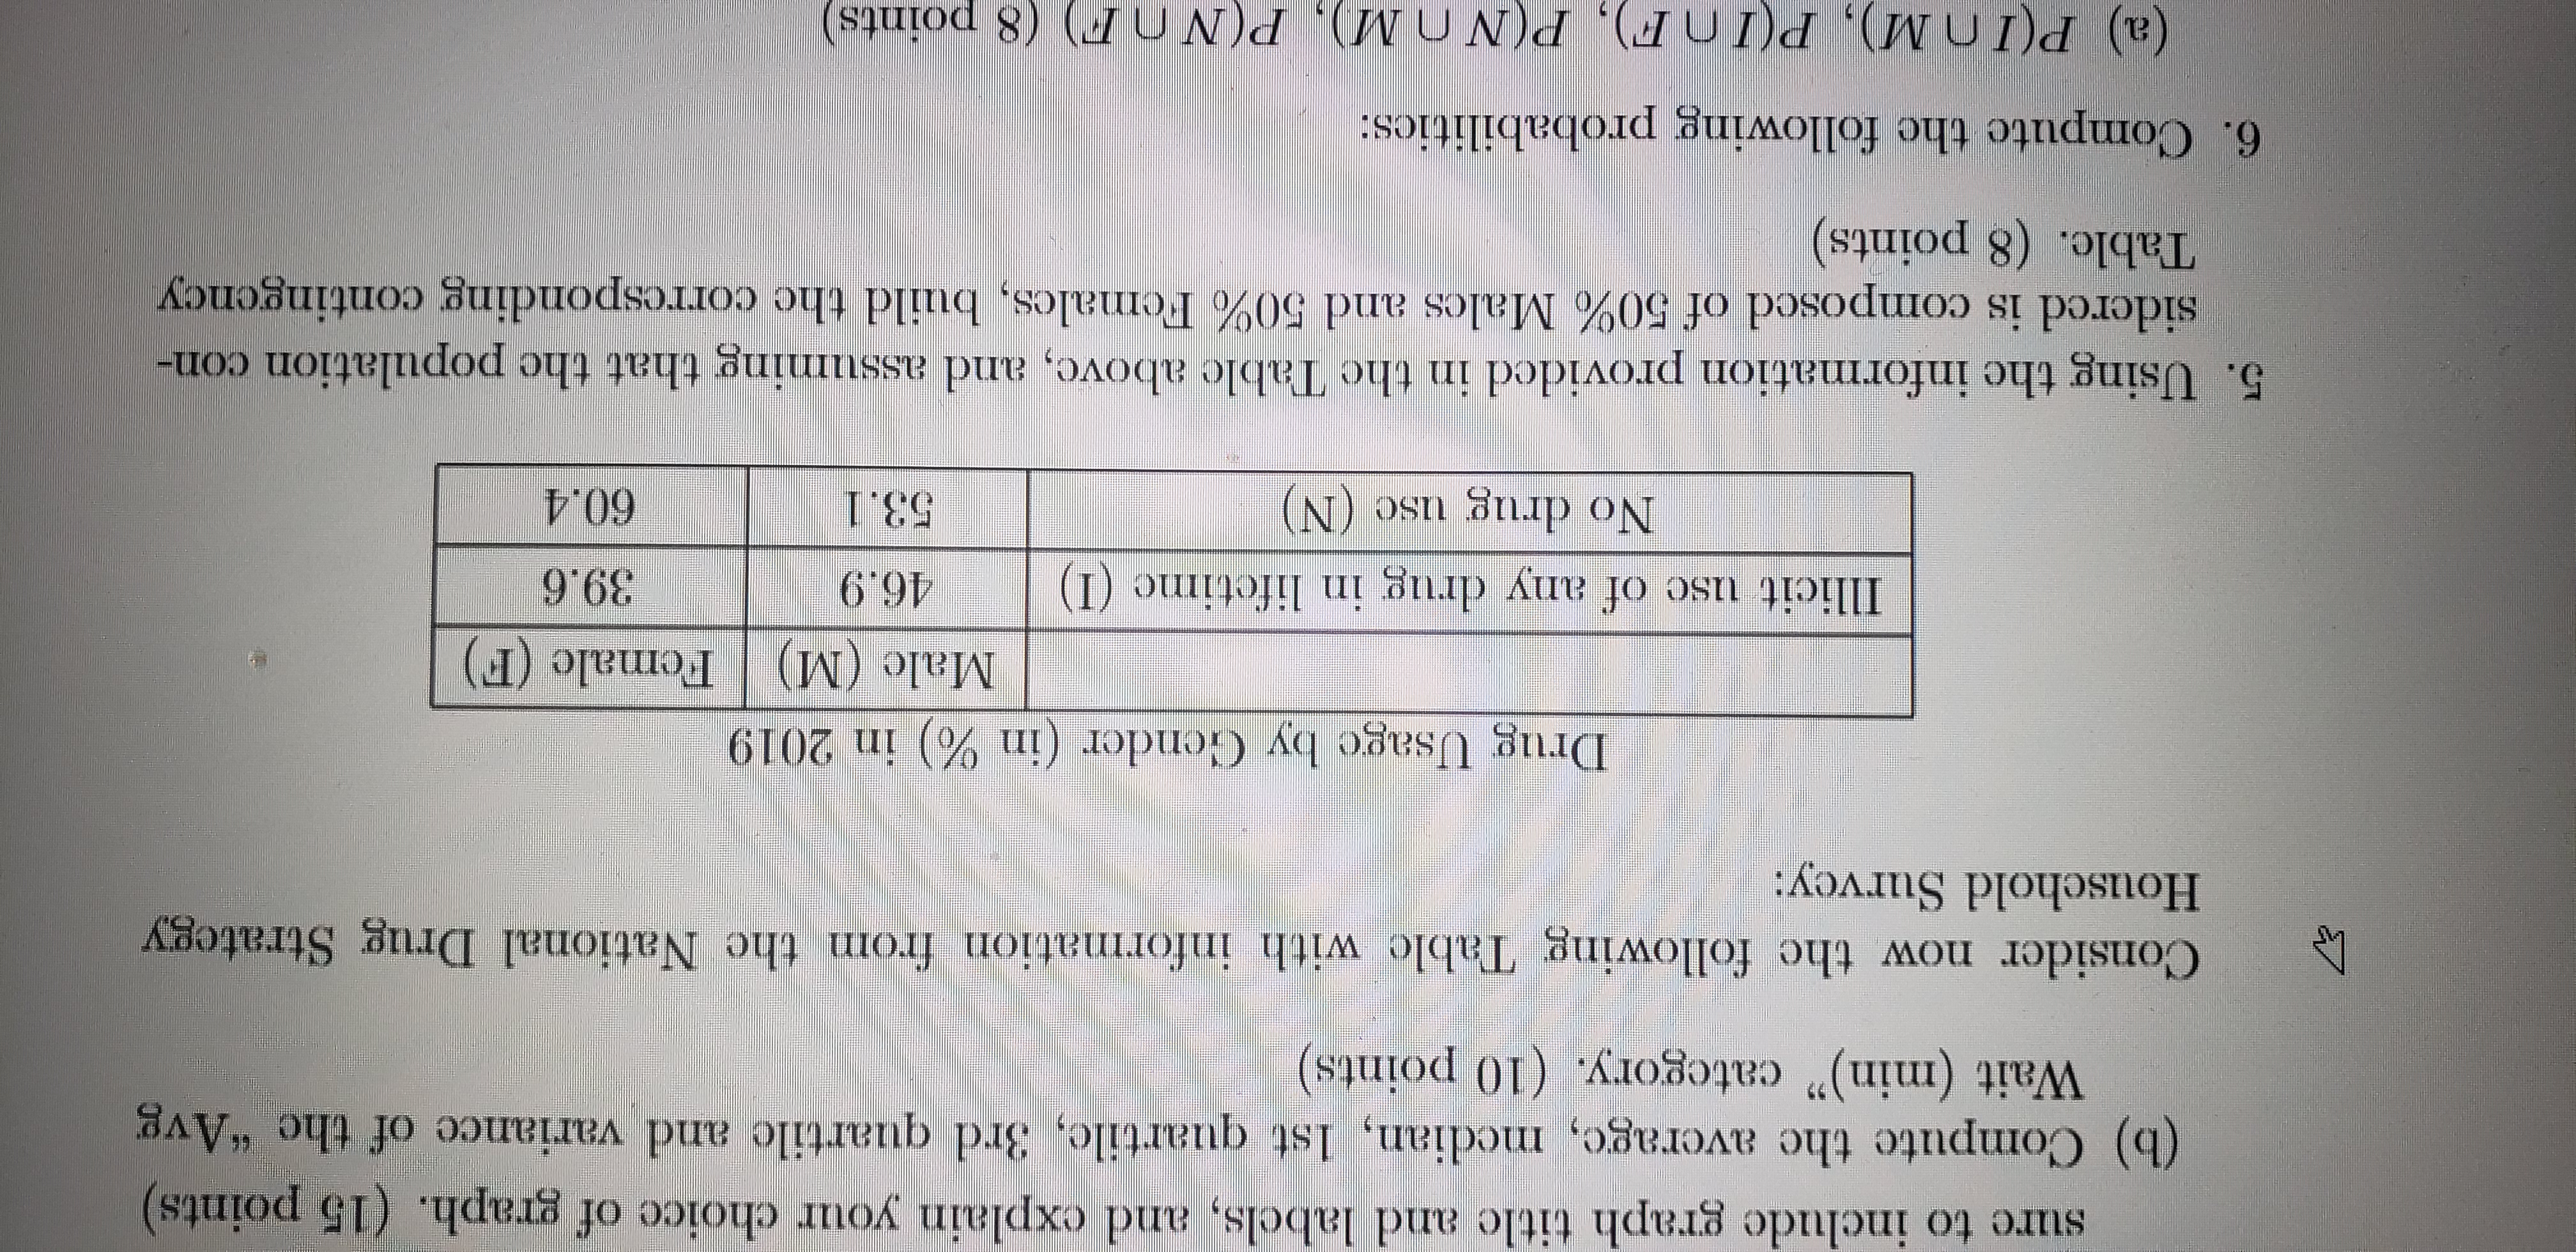
sure to include graph title and labels, and explain your choice of graph. (15 points) (b) Compute the average, median, Ist quartile, 3rd quartile and variance of the "Avg Wait (min)" category. (10 points) Consider now the following Table with information from the National Drug Strategy Household Survey: Drug Usage by Gender (in %) in 2019 Male (M) Female (F) Illicit use of any drug in lifetime (I) 46.9 39.6 No drug use (N) 53.1 60.4 5. Using the information provided in the Table above, and assuming that the population con- sidered is composed of 50% Males and 50% Females, build the corresponding contingency Table. (8 points) 6. Compute the following probabilities: (a) P(InM), P(InF), P(NOM), P(NF) (8 points)
Step by Step Solution
There are 3 Steps involved in it

Get step-by-step solutions from verified subject matter experts