

Question: Switch to the Process worksheet. Create a Scatter with Straight Lines chart based on range D 6 :I 1 4 in the data table Process
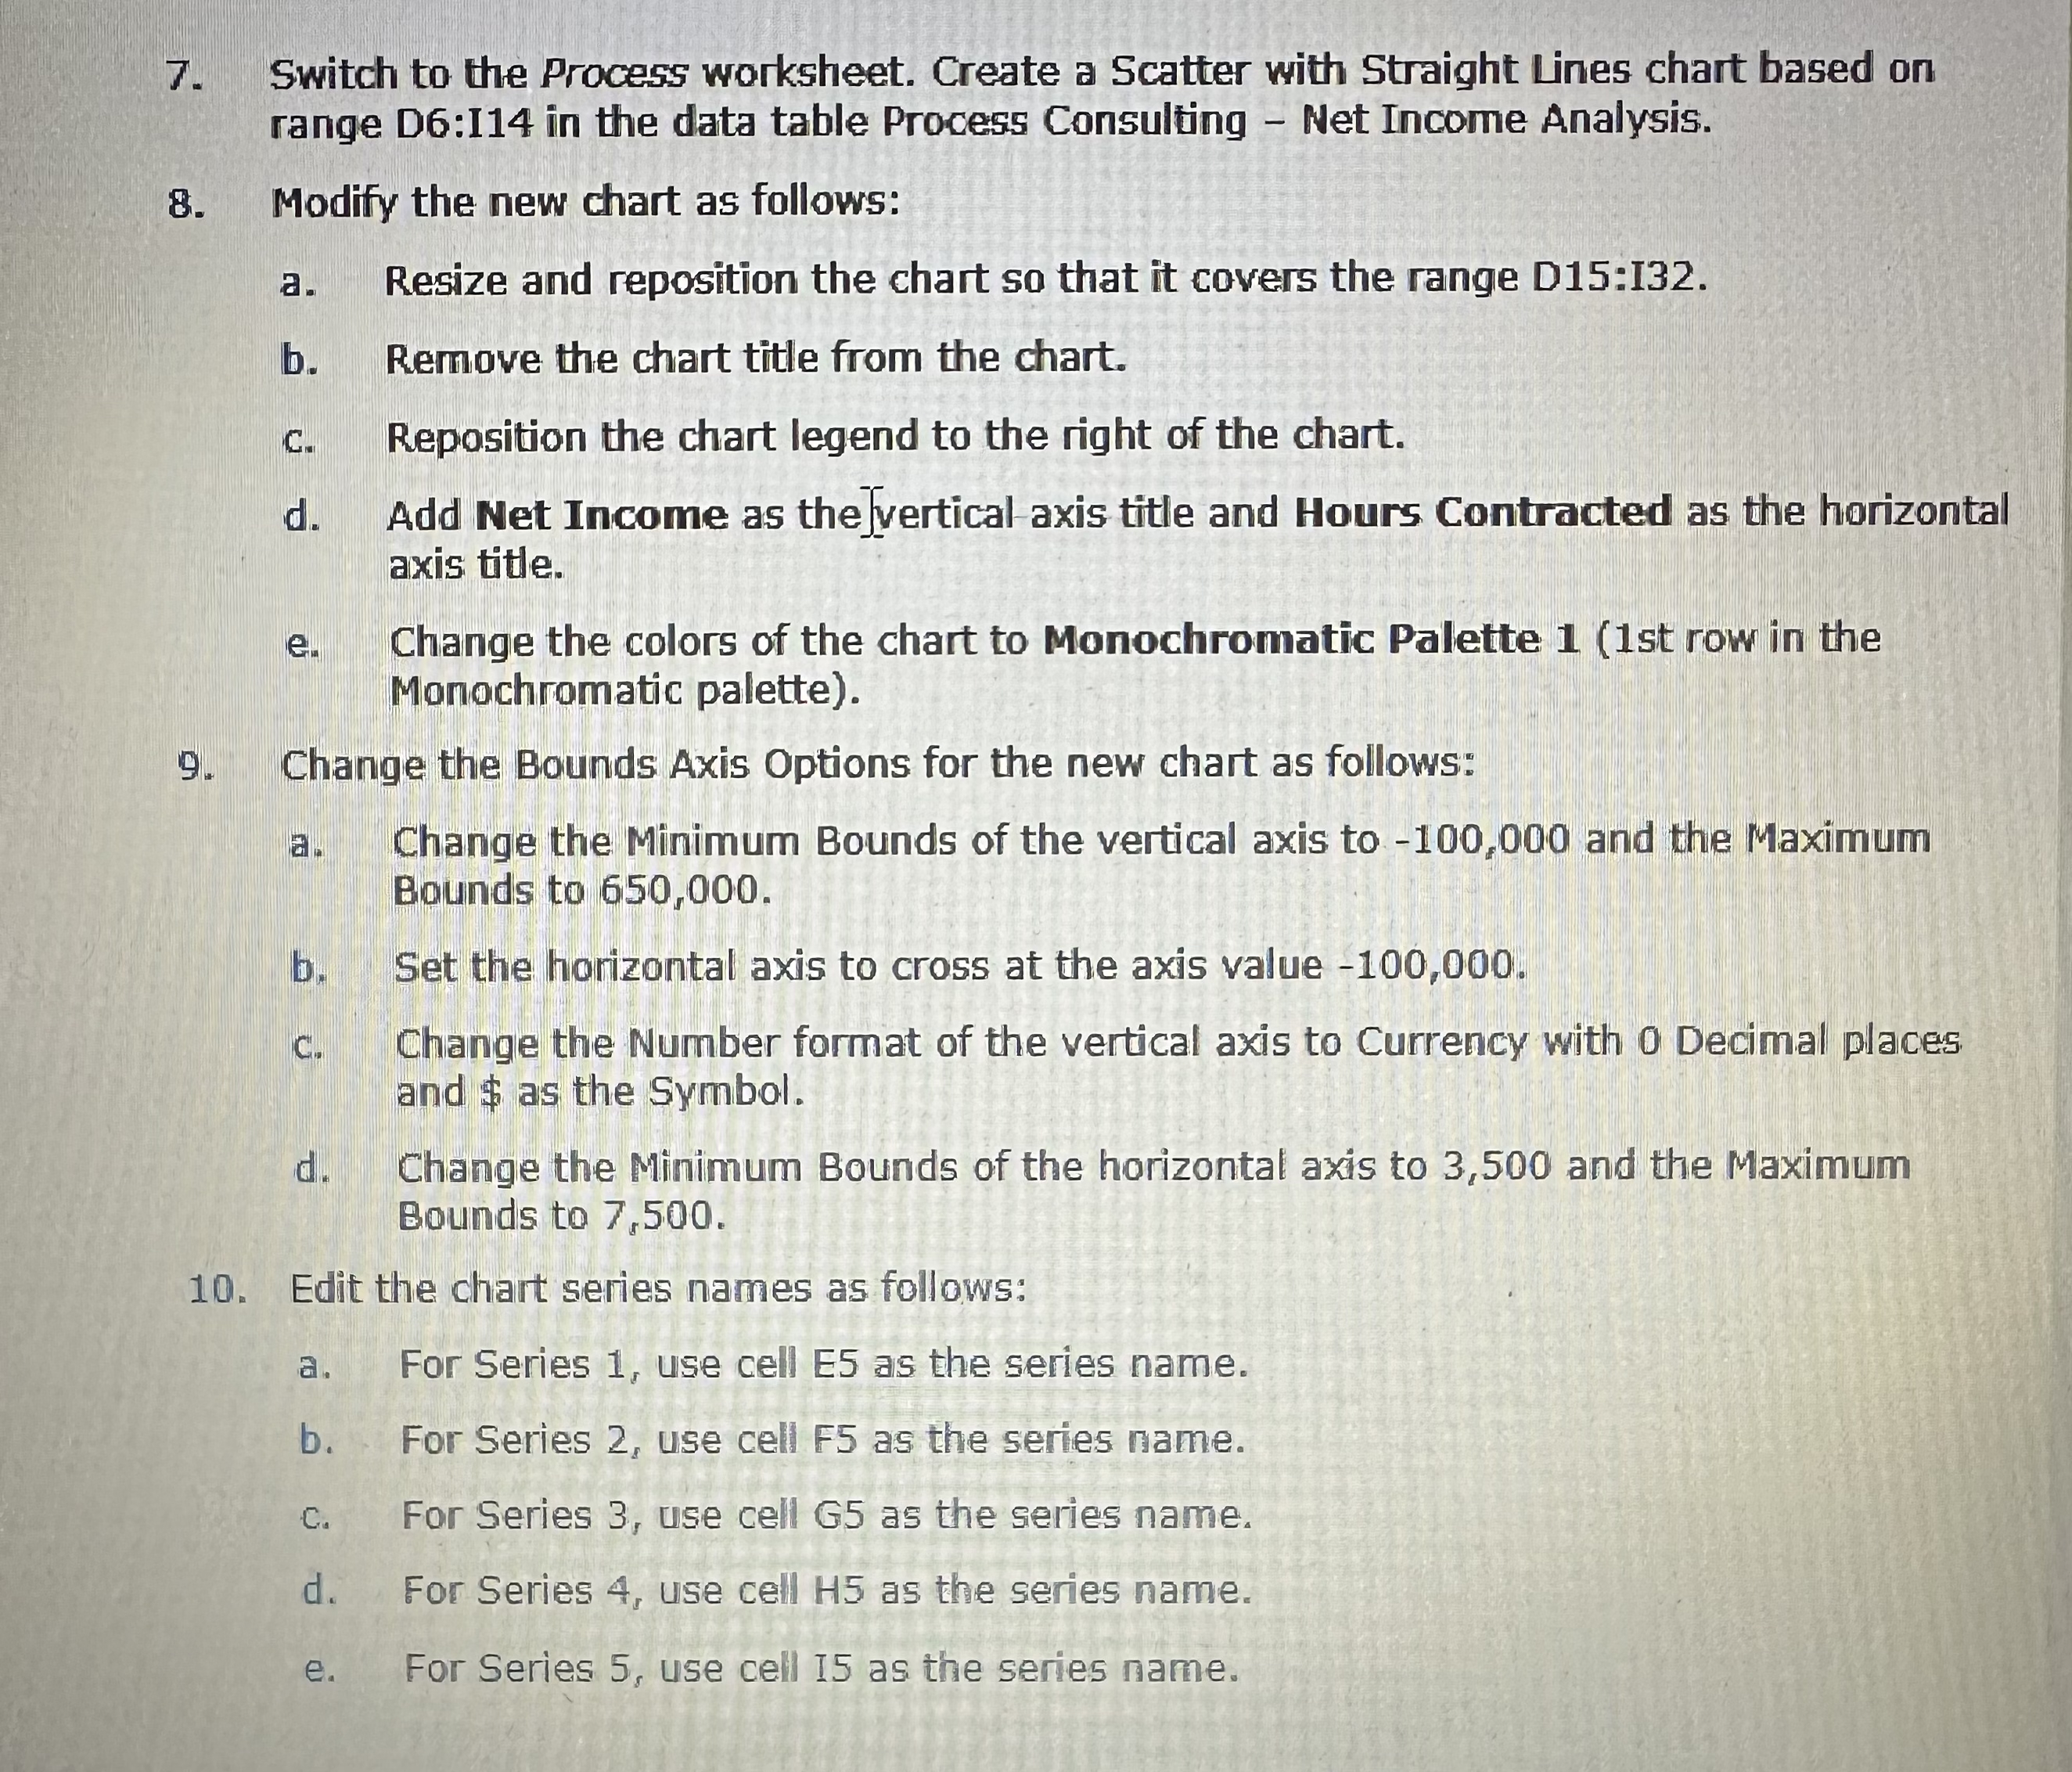
Switch to the Process worksheet. Create a Scatter with Straight Lines chart based on range D:I in the data table Process Consulting Net Income Analysis.
Modify the new chart as follows:
a Resize and reposition the chart so that it covers the range D:
b Remove the chart title from the chart.
C Reposition the chart legend to the right of the chart.
d Add Net Income as the Jvertical axis title and Hours Contracted as the horizontal axis title.
e Change the colors of the chart to Monochromatic Palette st row in the Monochromatic palette
Change the Bounds Axis Options for the new chart as follows:
a Change the Minimum Bounds of the vertical axis to and the Maximum Bounds to
b Set the horizontal axis to cross at the axis value
c Change the Number format of the vertical axis to Currency with Decimal places. and $ as the Syrmbol.
d Change the Minimum Bounds of the horizontal axis to and the Maximum Bounds to
Edit the chart series names as follows:
a For Series use cell E as the series name.
b For Series use cell as the series name.
c For Series use cell G as the series name.
d For Series use cell as the series name.
e For Series use cell I as the series name.
Step by Step Solution
There are 3 Steps involved in it
1 Expert Approved Answer
Step: 1 Unlock

Question Has Been Solved by an Expert!
Get step-by-step solutions from verified subject matter experts
Step: 2 Unlock
Step: 3 Unlock