

Question: SysRa Supply & Demand Problem Oil Market: Quantity Quantity Surplus/ Demanded Price Supplied Shortage 2,800 50 1,200 1, 600 shortage 2,300 100 1,500 800 shortage
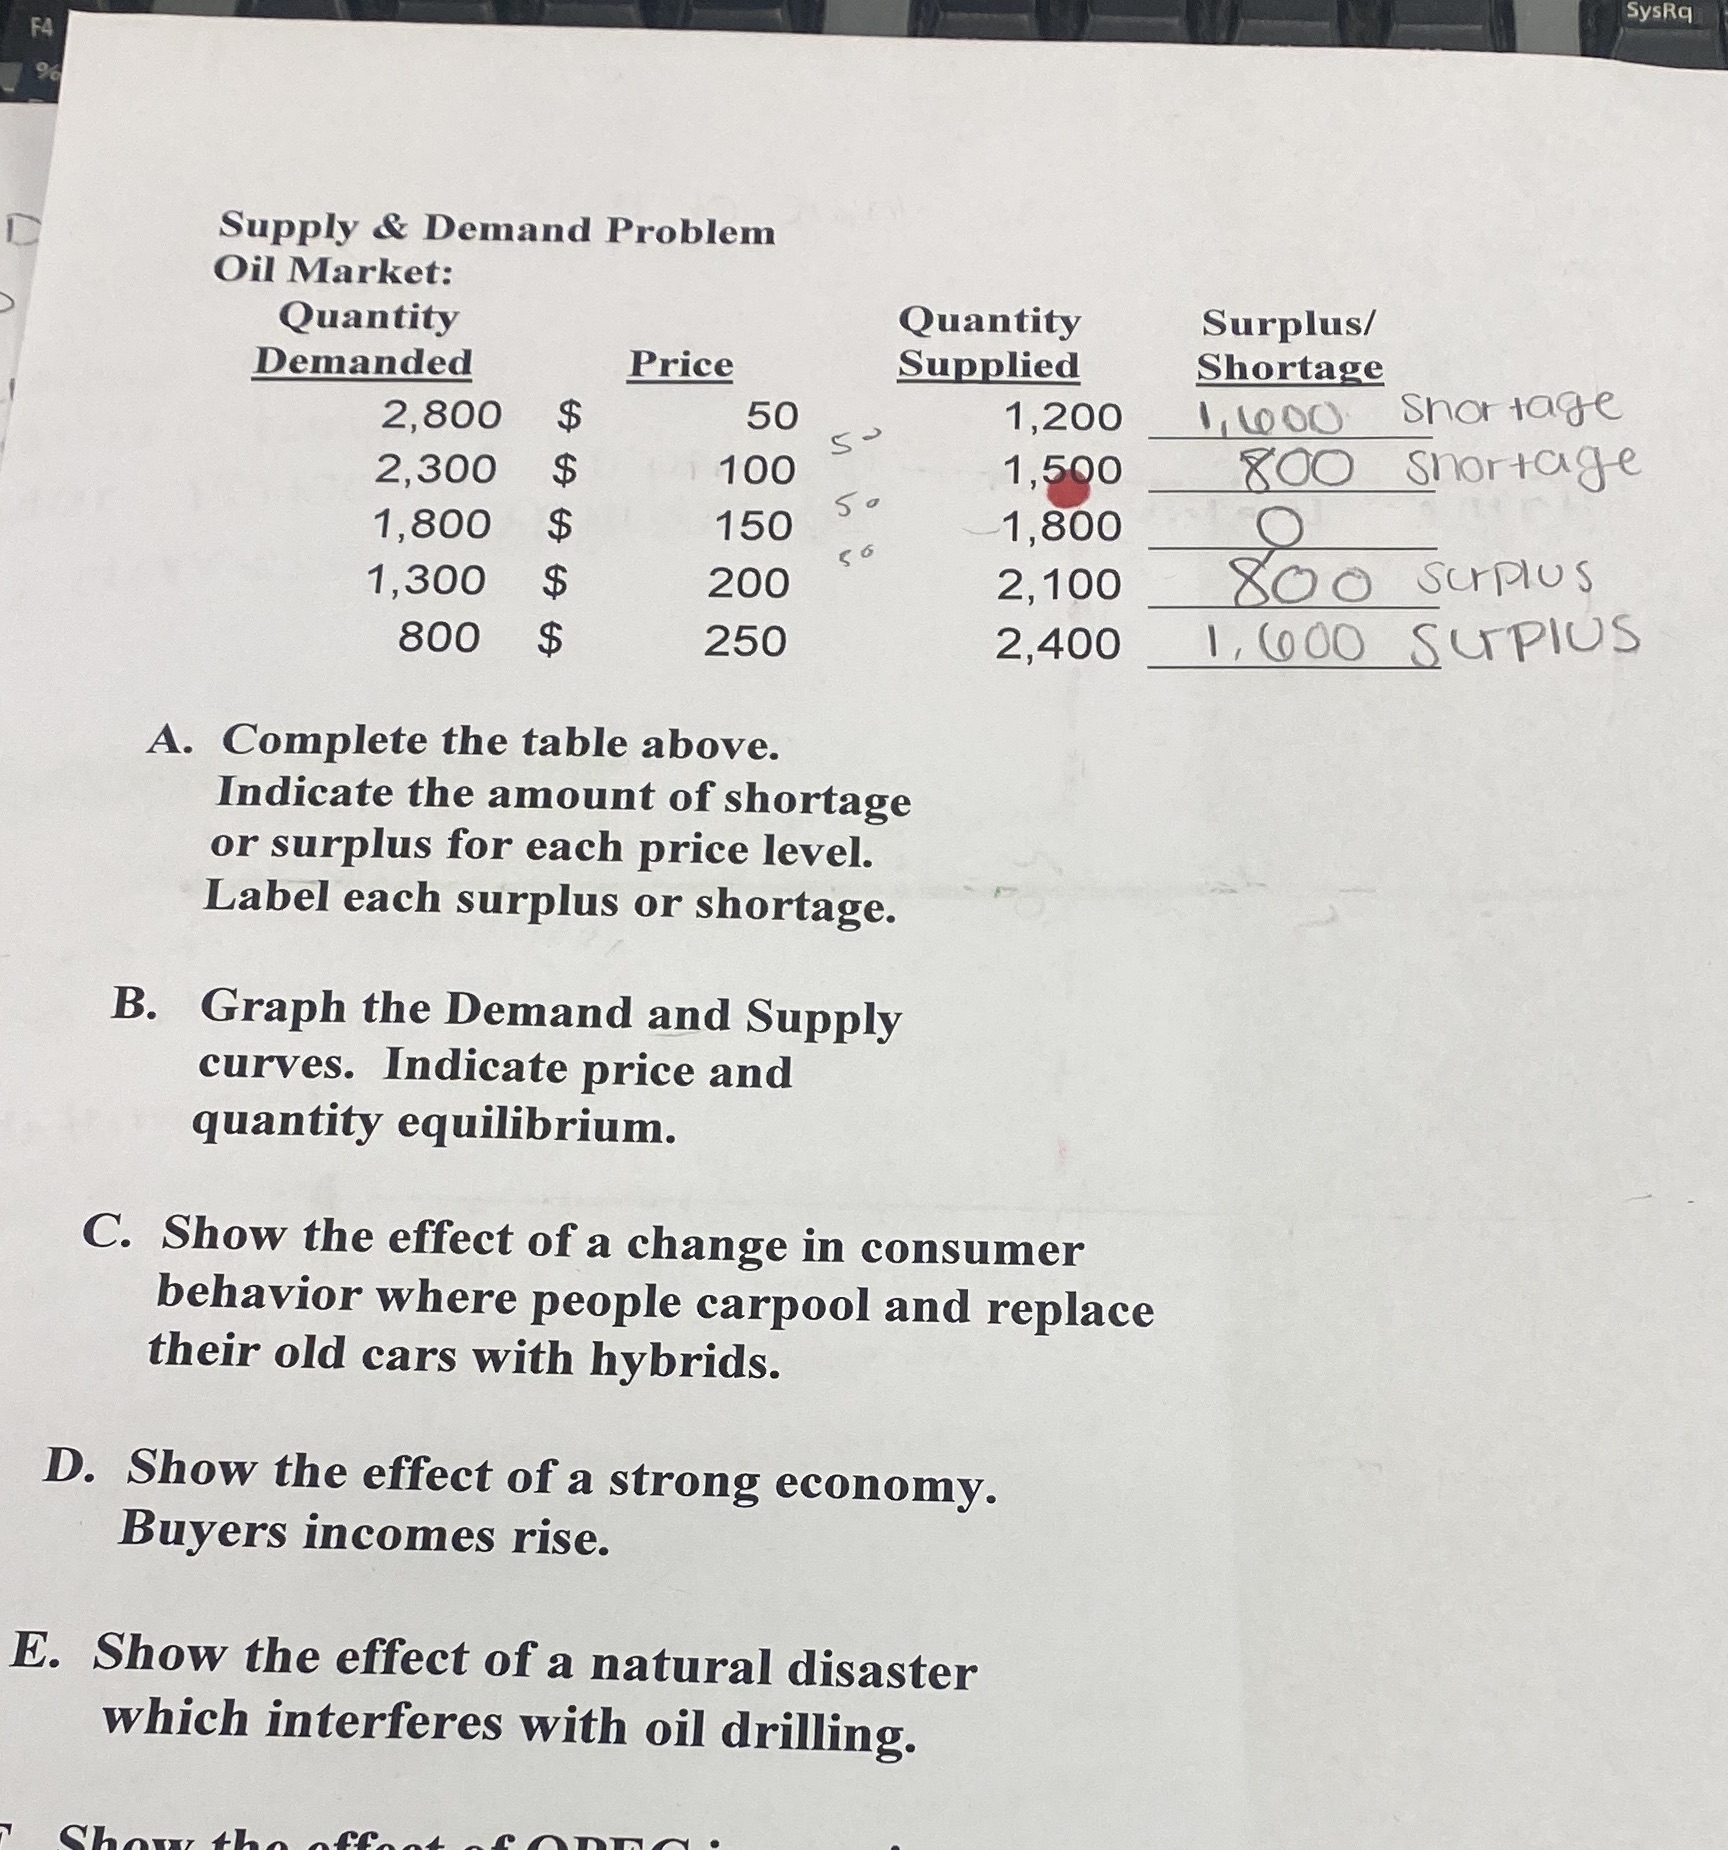
SysRa Supply & Demand Problem Oil Market: Quantity Quantity Surplus/ Demanded Price Supplied Shortage 2,800 50 1,200 1, 600 shortage 2,300 100 1,500 800 shortage 1,800 150 5 0 1,800 O 1,300 200 2, 100 80 0 surplus 800 250 2,400 1, 600 SURPLUS A. Complete the table above. Indicate the amount of shortage or surplus for each price level. Label each surplus or shortage. B. Graph the Demand and Supply curves. Indicate price and quantity equilibrium. C. Show the effect of a change in consumer behavior where people carpool and replace their old cars with hybrids. D. Show the effect of a strong economy. Buyers incomes rise. E. Show the effect of a natural disaster which interferes with oil drilling
Step by Step Solution
There are 3 Steps involved in it

Get step-by-step solutions from verified subject matter experts