

Question: t 3 4 5 9 8 9 10 N 1 11 7 14 yt No 14 13 8 11 1 13 8 10 lo 12

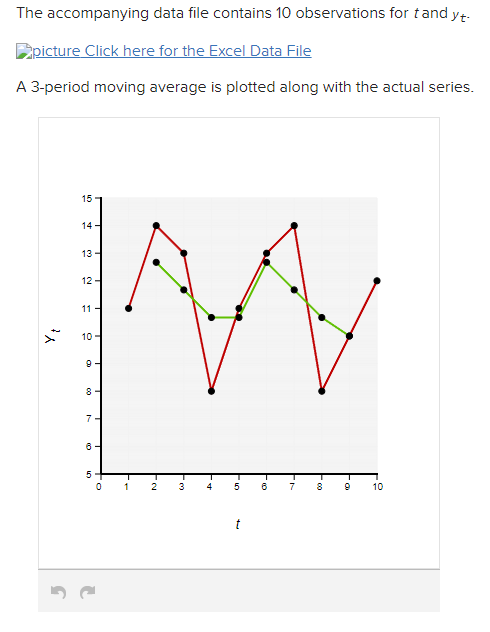
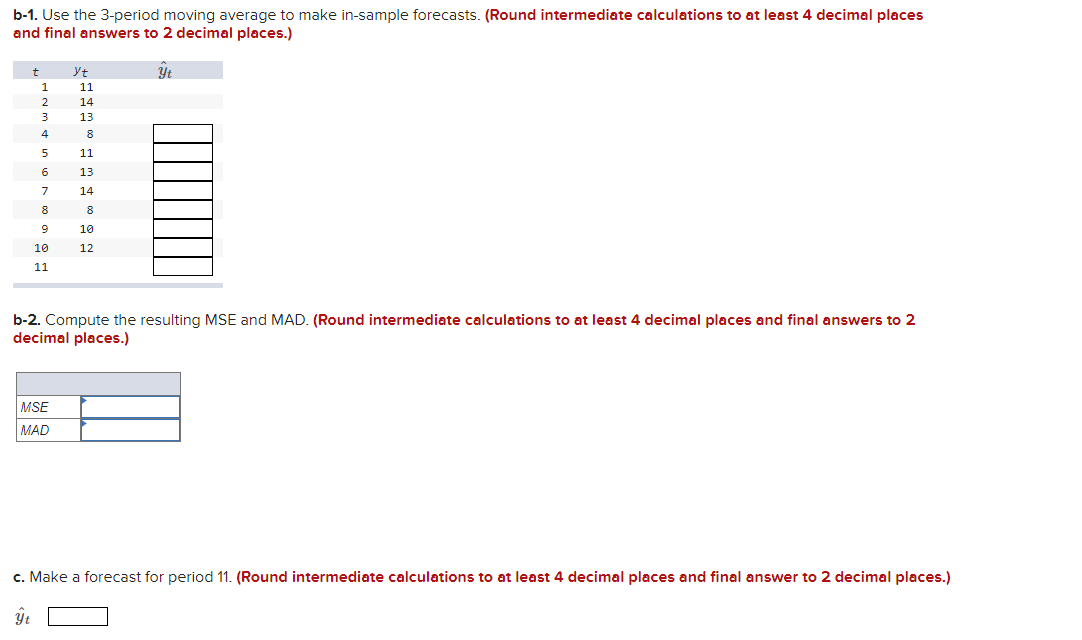
t 3 4 5 9 8 9 10 N 1 11 7 14 yt No 14 13 8 11 1 13 8 10 lo 12 The accompanying data file contains 10 observations for tand yt- picture Click here for the Excel Data File A 3-period moving average is plotted along with the actual series. 15 14 13 12 11 - Y 10 8 00 7 6 5 - O 1 2. 3 4 5 6 7 8 9 10 t b-1. Use the 3-period moving average to make in-sample forecasts. (Round intermediate calculations to at least 4 decimal places and final answers to 2 decimal places.) yt t 1 2 3 yt 11 14 13 8 4 5 11 13 6 7 14 8 8 9 10 10 12 11 b-2. Compute the resulting MSE and MAD. (Round intermediate calculations to at least 4 decimal places and final answers to 2 decimal places.) MSE MAD c. Make a forecast for period 11. (Round intermediate calculations to at least 4 decimal places and final answer to 2 decimal places.) yt
Step by Step Solution
There are 3 Steps involved in it

Get step-by-step solutions from verified subject matter experts