

Question: Tab Chrome File Edit View History Bookmarks Profiles + 60 m Quiz Test #1 (Midterm) + + C i fuinstructure.com/courses/108392/quizzes/628144/take 15 pts ... Honorlock Proctoring
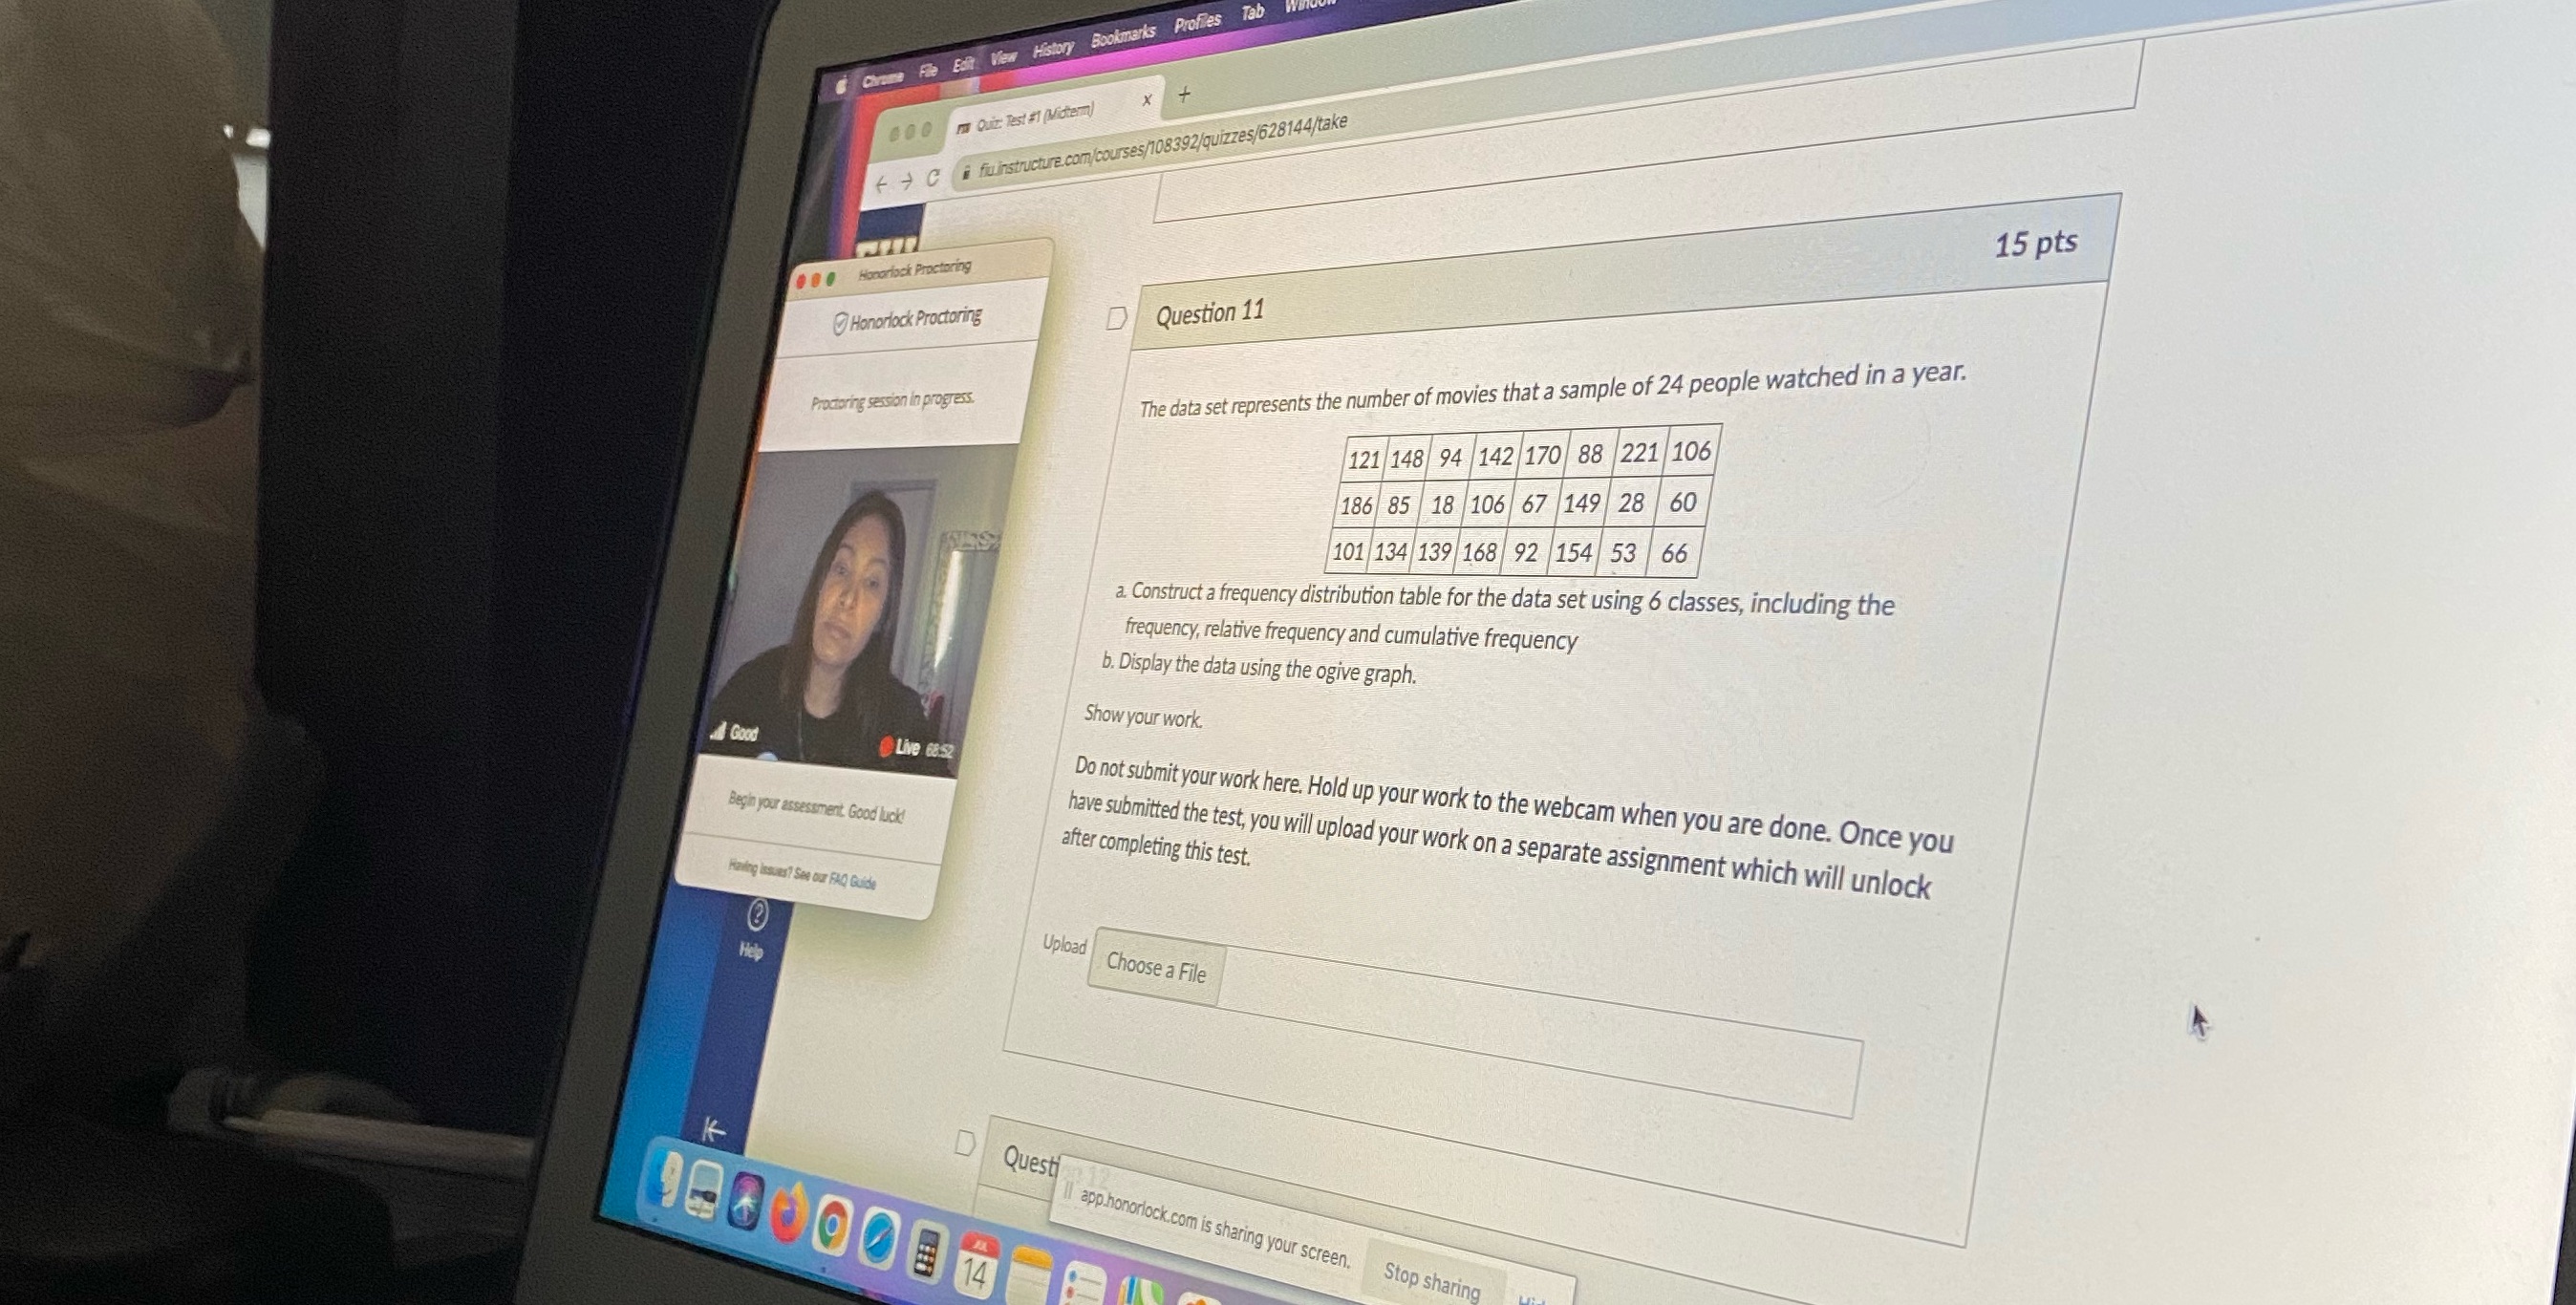
Tab Chrome File Edit View History Bookmarks Profiles + 60 m Quiz Test #1 (Midterm) + + C i fuinstructure.com/courses/108392/quizzes/628144/take 15 pts ... Honorlock Proctoring Honorlock Proctoring D Question 11 The data set represents the number of movies that a sample of 24 people watched in a year. Proctoring session in progress. 121 148 94 142 170 88 221 106 186 85 18 106 67 149 28 60 101 134 139 168 92 154 53 66 a. Construct a frequency distribution table for the data set using 6 classes, including the WE frequency, relative frequency and cumulative frequency b. Display the data using the ogive graph. Show your work. Good Live 68:52 Do not submit your work here. Hold up your work to the webcam when you are done. Once you Begin your assessment. Good luck! have submitted the test, you will upload your work on a separate assignment which will unlock after completing this test. Having Issues? See our FAQ Guide Upload Help Choose a File K D Questi app.honorlock.com is sharing your screen. 14 Stop sharing
Step by Step Solution
There are 3 Steps involved in it

Get step-by-step solutions from verified subject matter experts