

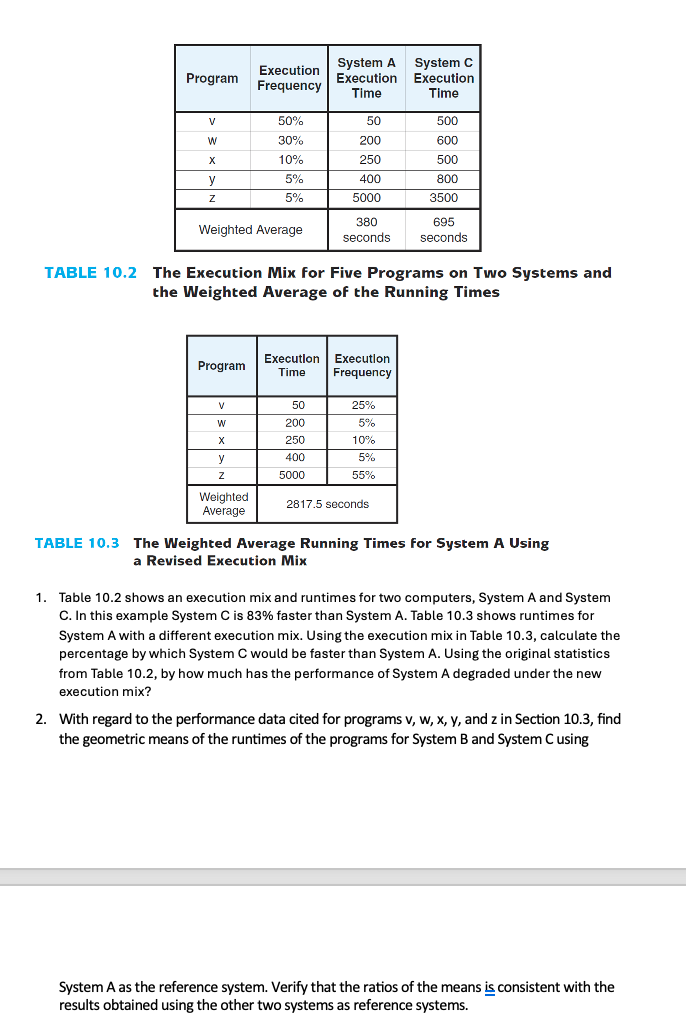
Question: TABLE 1 0 . 2 The Execution Mix for Five Programs on Two Systems and the Weighted Average of the Running Times TABLE 1 0
TABLE The Execution Mix for Five Programs on Two Systems and the Weighted Average of the Running Times
TABLE The Weighted Average Running Times for System A Using a Revised Execution Mix
Table shows an execution mix and runtimes for two computers, System A and System C In this example System C is faster than System A Table shows runtimes for System A with a different execution mix. Using the execution mix in Table calculate the percentage by which System C would be faster than System A Using the original statistics from Table by how much has the performance of System A degraded under the new execution mix?
With regard to the performance data cited for programs mathrmvmathrmwmathrmxmathrmy and z in Section find the geometric means of the runtimes of the programs for System B and System C using
System A as the reference system. Verify that the ratios of the means ig consistent with the results obtained using the other two systems as reference systems.
Step by Step Solution
There are 3 Steps involved in it
1 Expert Approved Answer
Step: 1 Unlock

Question Has Been Solved by an Expert!
Get step-by-step solutions from verified subject matter experts
Step: 2 Unlock
Step: 3 Unlock